Trace Helper Utility for Epicor ERP 10

So we’ve been working on a little utility to help parse the Epicor Trace Files and make development a little easer.
Here is a walk through

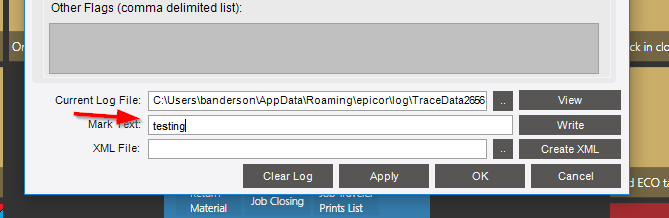
Below is some more info on how to use it. The most important but is how you setup your Trace. Your trace should be setup as shown
image

I know we (most of us) normally say “Track Changes Only” but this is big bold lie, it shows us what has changed in the data-set (even stuff we haven’t manually changed). This tool breaks through some of that confusion by showing exactly what has changed and who/what changed it. Via simple diff/winmerge style editor / viewer.

Whatch the video above and it will make a lot more sense.

To use it simply load a trace file (in the above mentioned format ONLY)

It will generate a list of BO and methods which called said BO. Then you can not only see clearly what parameters were sent to the method but also see the real changes made on the dataset from Call to Call.
For example what changed between my call to GetNewXX and my call to Update() you can clearly see what changed on the dataset


and even go as far as look at a mock up of the code needed to make that change to your dataset (WIP)

Further more if you compare a method to itself say Update to Update you can see what the business Object changed. What was sent to the method and what changed on the server side and was sent back.

Anyways give it a whirl and let me know your thoughts. This also has an auto update built right in so as I make changes those changes should be pushed out.

As always this is FLOSS available at GitHub - jose-josh-do-dev/EpicorTraceDiffer: Allows you to Parse and process Epicor Trace Files Easily.

You can download the Installer Here

Enjoy and any feedback is appreciated.

PS: The ui is a little clunky (any suggestions on that are appreciated) but basically the “Prior” method to compare to is on the Right because well… That’s where I put it ¯\(ツ)

As always this software is given for free as is with no actual intent or purpose, use at your own risk yada yada yada I’m not responsible for you breaking your SH*T

-Cheers

50 Likes

Dudes. That is sweet.

6 Likes

That’s AMAZING! What a great tool, and to give it to the community for free is even more AMAZING! Love the Code tab, that will save loads of time!

Thanks @josecgomez

3 Likes

Thanks @markdamen, let me know if you run into any issues with it.
-Cheers

1 Like

Guys, this really is an excellent idea/tool!!! Thanks for sharing!!! Usually, I set tracing options to write the XML file and use XML Notepad and Notepad++ to do what your app does, but this is so much easier!!! And the code windows is a great addition!

Got a couple of things for you :slight_smile:

If I choose inappropriate methods to compare, I get a popup error that you may want to revisit for clarity. This happened when I tried to compare two GetByID() methods (I know, I know…but I’m just ‘testing’ it…)
image

And I’ve noticed that the Epicor client doesn’t release the trace file (or finish writing to it) until you close the client - do you know anyway around this? Am I missing something? I’d love to be able to use this without having to close the client altogether like I can using the XML Notepad method. (I tried the generated XML file already and the app doesn’t like it)

Lastly, can we sort the BO listing? :slight_smile:

I’ve run about 10 trace files through it and I love it!! This is awesome!

1 Like

Thanks @MikeGross I’ll try to fix that message, you can click View Trace and do a Save As that’s how I’ve done it. To cause it to “release” earlier.

1 Like

Aren’t they sorted in the order that they fired?

They are, however the BO dropdown doesn’t matter the order too much. The methods dropdown you wanna keep as is.

I think I would still vote to keep them in order. Some places getting a trace you can’t be as surgical as you would like (Like in MES modal screens) so you have a lot more in there than you want, but there isn’t a good way around it. Having those in the right order helps me figure out where I need to be.

1 Like

I see what you mean, and I don’t disagree. It’s all very usage dependant - as are all UI considerations. Perhaps it’s an option? And if we’re talking about options, can we get an option to ignore the ‘background noise’ like the heartbeat and system monitor BO’s? :wink:

I also tried the ‘mark text’ comment to see if it showed up and it doesn’t. That is usually how I find my way through my trace file by leaving myself breadcrumbs. If those showed up in the BO list as well, then we could easily find our way through a long BO listing and target the exact location we’re looking for.

Can you elaborate on what you mean by that? It sounds interesting, but I don’t quite get what you are doing.

Edit: Figured it out. You can add some text and write it to the trace as you go. Neat!

image

image

1 Like

what an excellent development pal, it is going to be really useful tracing tool, many thanks @josecgomez

So @MikeGross what / how would you like to see these marks?
Looking at the structure of the trace with these in they are independent and “random” nodes not sure what I can do with them?
Ideas?

Mark text seems more important for human reading…although, you could use them to say filter anything before and after… :thinking:

1 Like

@Mark_Wonsil might have the idea on this one - a text box for us to enter our tag and then filter out before/after that tag. Although, if you load it up with tags, remembering your exact tag might be tricky.

Perhaps, you could list all the tags in a dropdown, and be able to select a tag and a Filter action, or possibly other actions that we come up with.

I always close System Monitor before starting a trace - cuts out the noise :+1:

@markdamen -true, but sometimes the printing process (or task processing) is integral to the whole process you are mapping out to see what is going on. And there are a few other ‘system’ noises in the background that we never/rarely look at like UserTracingImpl and possibly ClientCache, LangNameImpl, NamedSearchImpl, QuickSearchImpl, SessionModImp, SchemaImp . Would be nice to optionally filter those out - perhaps via an .ini file we can modify?

All right I think this is the best I can do for the TraceGrouping (for now)

I also fixed the messages and added the sort button

Update should be pushed out (shortly) when you launch the program.

It will let you filter to show only things “After” a particular Trace Note.

As far as removing the noise, it packages those neatly for you in a individual BO
you know that ReportMonitor is not one you’ll probably ever need, so just ignore those in the bo DropDown?

2 Likes

I’ve also tested the auto-update feature and it works!! :+1:
And so does the Sort & Filter options! Thanks @josecgomez!

2 Likes

@josecgomez - yes, the ‘noise’ is simple enough to ignore, but was one of those ideas you have when looking at a new UI from scratch - you pitch them out and see what the masses think. Not all are good enough to make the cut and some turn out to be :poop:

1 Like