Memory Leak - Test App Server

Looks like we may have a memory leak in our test app server as the w3wp process rapidly increases (found it sitting at 70gb over the weekend :scream: )
I’ve stopped the app pool for longer than the shutdown time to ensure the processes are terminated and I fully rebooted the server, but the moment that test app server comes back up, the w3wp process starts immediately climbing.

How can I identify what’s causing the leak and kill it?

If its coming right up when you restart the appserver I’d guess is a scheduled process. Do you run MRP? any scheduled BAQs or BAQ Reports?
Anything in the Logs? Any big dump files in the EpicorData folder?

No scheduled tasks–they’ve all been deleted in test. (Confirmed by SQL query as well).

As far as the log–I see a large amount of these:

  <TriggerProvider msg="Creating Erp.Triggers.OrderDtl.WriteTrigger trigger" machine="ISIEPICOR" pid="51380" tid="100" />
  <TriggerProvider msg="Creating Erp.Triggers.OrderDtl.WriteTrigger trigger" machine="ISIEPICOR" pid="51380" tid="100" />
  <TriggerProvider msg="Creating Erp.Triggers.OrderDtl.WriteTrigger trigger" machine="ISIEPICOR" pid="51380" tid="100" />
  <TriggerProvider msg="Creating Erp.Triggers.OrderHed.WriteTrigger trigger" machine="ISIEPICOR" pid="51380" tid="100" />
  <TriggerProvider msg="Creating Erp.Triggers.OrderDtl.WriteTrigger trigger" machine="ISIEPICOR" pid="51380" tid="100" />
  <TriggerProvider msg="Creating Erp.Triggers.OrderHed.WriteTrigger trigger" machine="ISIEPICOR" pid="51380" tid="100" />
  <TriggerProvider msg="Creating Erp.Triggers.OrderDtl.WriteTrigger trigger" machine="ISIEPICOR" pid="51380" tid="100" />
  <TriggerProvider msg="Creating Erp.Triggers.OrderHed.WriteTrigger trigger" machine="ISIEPICOR" pid="51380" tid="100" />
  <TriggerProvider msg="Creating Erp.Triggers.OrderDtl.WriteTrigger trigger" machine="ISIEPICOR" pid="51380" tid="100" />
  <TriggerProvider msg="Creating Erp.Triggers.OrderDtl.WriteTrigger trigger" machine="ISIEPICOR" pid="51380" tid="100" />
  <TriggerProvider msg="Creating Erp.Triggers.OrderDtl.WriteTrigger trigger" machine="ISIEPICOR" pid="51380" tid="100" />

Does the Event Viewer (Windows) under Administrative Events, show any weird warnings or repetitive messages?

2019-04-08_1001


Also what OS, What Epicor Version?


Do you have any crash dumps? in like

C:\windows\minidump

Do you have anything in the IIS Admin Console, can you check
2019-04-08_1004

Thats odd something is triggering the EF Triggers which are like SQL Triggers but on the Entity Framework side.

Any recent windows updates installed, can you check update history?

Windows Server 2008 R2 - Epicor 10.2.200.11
No recent updates to either Epicor or Windows.

No events.
There’s no crash dump directory like that.
There’s nothing under the “View Requests” for the TEST App Pool.

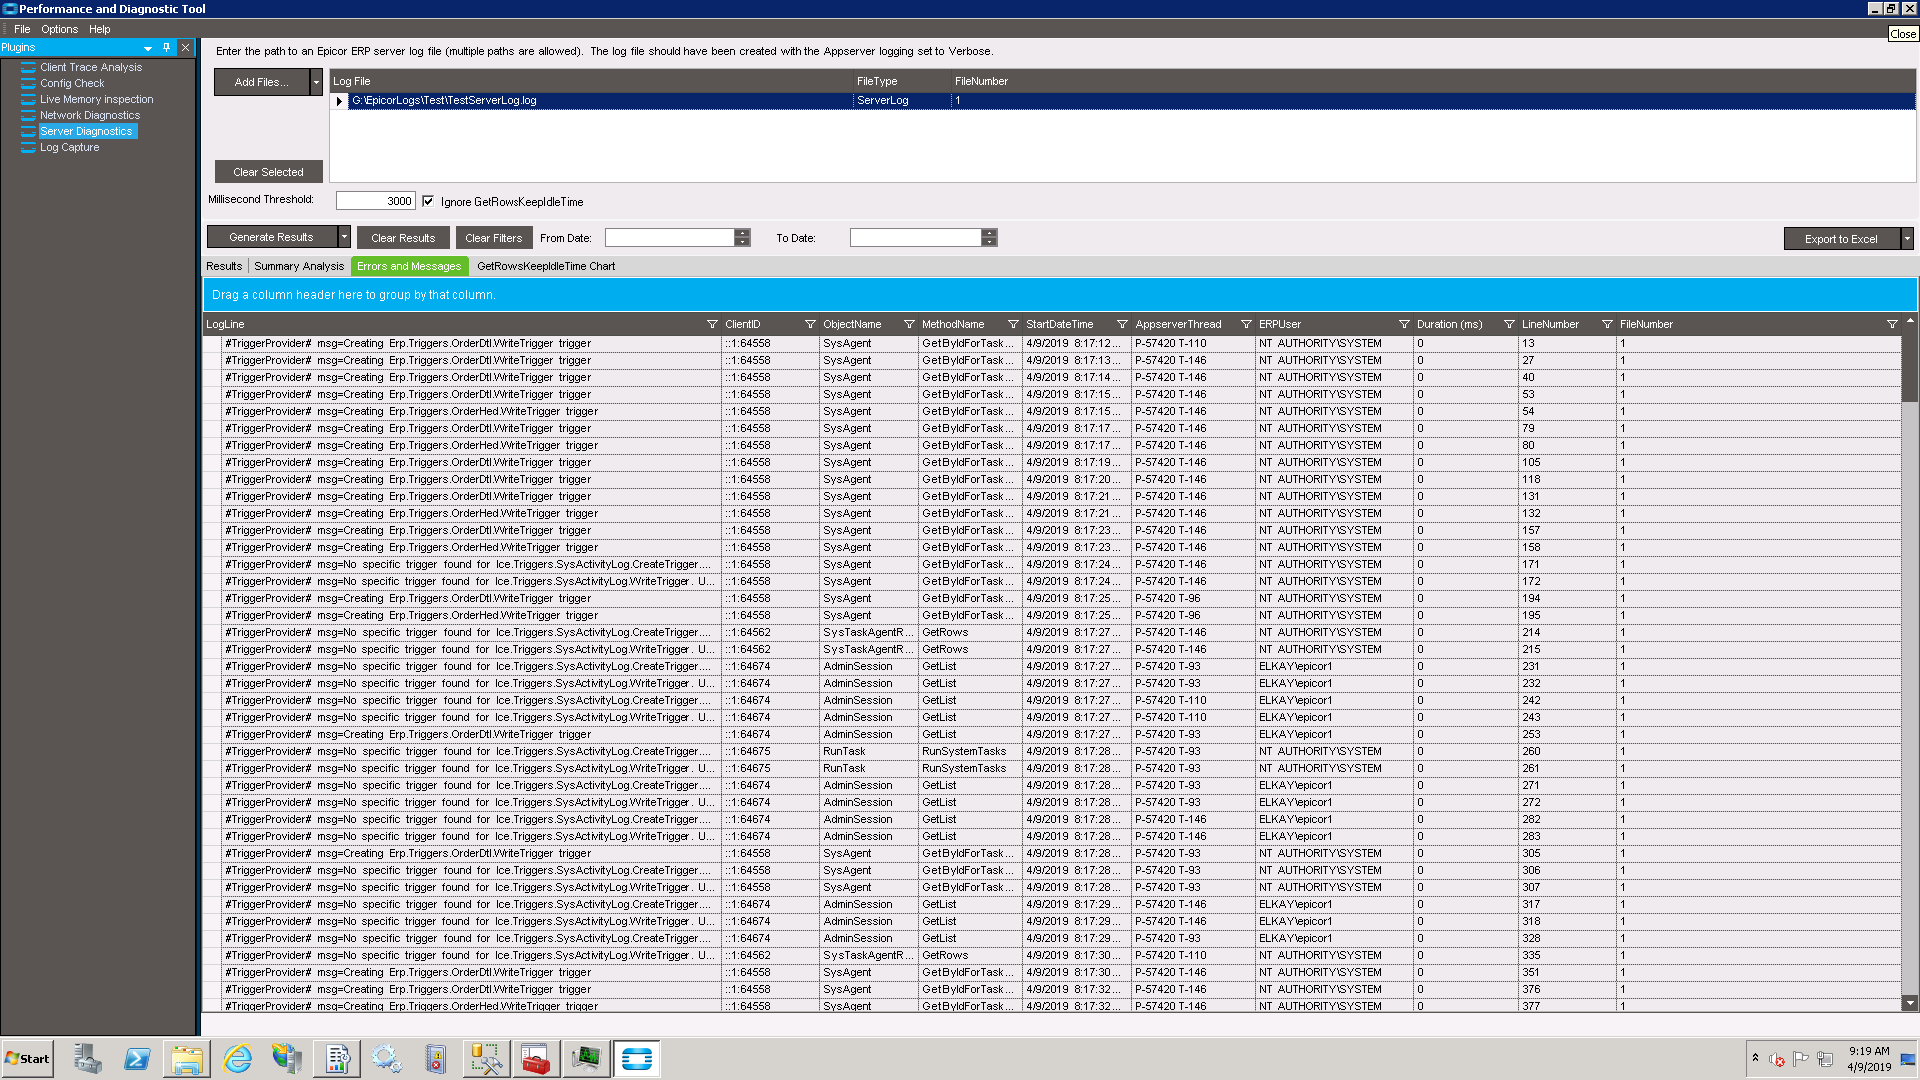
The only thing I can think of is go to your Admin Console and under Server Settings on the Instance enable all the trace logging. To make sure we get alot more info in the logs.

Enable it All

Even on the AppServer IIS Directory there is AppServer.config there may be other events you can enable not listed on the UI Dialog.

If you go to your SQL Log Directory
Ex:

\\SERVER\SQLDATA\MSSQL12.MSSQLSERVER\MSSQL\Log

Look for ERRORLOG see if that has anything.

So, interestingly, once I enabled full logging, the process stabilized…
Didn’t see anything of note in the Epicor logs or the SQL ones.

Perhaps the triggers logging caused it to go crazy, maybe when you enabled some other type of logging the triggers stopped logging? I know some of those types override each other if i Recall.

Hmm interesting, see if you can set it back and replicate the issue :slight_smile:

Lol, I tried. :stuck_out_tongue:
It still seems stable.

1 Like

Whelp… I’ll keep an eye on it.
Hopefully, that fixed it? Lol

that’s the kind of stuff that creeps a guy out to the point you can genuinely lose weight over it.

3 Likes

image

1 Like

Sometimes the computer has a “Mind”… it “KNOWS” you are looking, and it changes its behavior without you doing anything…
I KNOW that there has been times in the past where I had a suspected bug/misbehavior, so I looked at the code (didn’t recompile), and the problem suddenly went away.

I believe there is a memory leak tester tool available in the PDT tool. Have you tried that?

It’s back! Turns out I had stopped the Task Agent and forgotten about it.
Running just the app server is fine, but once I start up the Task Agent, the worker process starts growing.
I enabled “Display All Tasks” and there’s nothing actively running or scheduled.
Is there something hidden?

I did some imagining: Reporting Overflow! - #4 by josecgomez - ERP 10 - Epicor User Help Forum

**Edit – I lied. It stabilized for about 5 minutes, then went right back up.
Boooo. Any other ideas?

Did you enable all the logging above? what do you see in your logs actively?

I see massive amounts of these trigger-thingies (highly technical term).