Standard (Epicor Specific) Performance Testing?

I am thinking about performance (specifically as it relates to upgrading or changing hardware / OS / SQL versions) and wondering what the best (easiest) and or maybe existing way would be for testing Epicor Specific Performance.

One of the things that came to mind was to create DMT Playlist of some of the heavy hitters and have it run through on the Epicor Education DB on each of the different hardware environments to compare apples to apples

Anyone else know of a better way?

Yes, we tried that as well. Another thought are any processes that you know that take time. Example might be MRP, Cost Roll, Generate PO Suggestions.

You could time what you have and then do the same in E10 to see. I can tell you for sure that E10 is much faster. We were able to move MRP from 3 months to 12 months and run it about the same amount of time. Cost roll is much faster as well.

How big is your database and how long does MRP take currently?

image001.jpg

Thanks Matt,
We are already on E10 just looking into upgrading / shifting / changing hardware.

I’ve been looking at Azure Monitor lately. Obviously, it works with cloud work loads but it also works for On-Prem systems with a system agent. Any performance testing would have to include what’s happening on the server (cpu, memory, etc.). Azure Monitor takes whatever you send it and then helps you correlate the data. in addition to agents, you can send your custom data via REST if you want. I can see an Azure Function checking on license counts and mapping that out. And it’s possible to use Azure Application Insights On-Prem which is fed to Azure Monitor.

Monitoring is an mandatory requirement to promote a good DevOps practices.

Here’s a YouTube playlist for Azure monitor for an idea of what’s possible. Pricing is based on multiple criteria (ingested data, storage, notification, etc.) but I think standard Epicor company can get by for less than $50/month and probably much less depending on what you want to do.

So with that, you could always spin up various systems in Azure to get a “feel” for what changes based on CPU size, memory, etc. Using the Test Labs options drops the costs of licenses too.

Food for thought…

Mark “someday, you’ll all be :cloud:” W.

1 Like

I think the issue with the Demo DB is that it isn’t a very big database. Our production DB is 5-7x larger. Maybe you could use a backup of your prod system to more accurately predict the performance you will get.

You can’t make me! #NeverCloud #OnPrem4Ever

2 Likes

True, I was just trying to make sure it was apples to apples… but yeah that could work

@josecgomez
I just worry that if the DB is only a few GB it would all get loaded into RAM and you would never get a real test of dive cacheing, IO, and things like that.

Very true, good point

How do you know if your DB is being loaded into RAM?

you’d be best doing some analytics of what your biggest processes are actually hitting (IE look at your hardware util while running the tasks) and then target that hardware spec during your upgrade, I’d love to know how well threaded ERP10 is… is it capable of using all cores of a pair of 40 core CPU’s? does it get memory bandwidth limited?

anyone able to get this sort of data out of a Epicor Public cloud hosted server?

@josecgomez We use Veeam Virtual Labs to replicate our DB/App server and spin up copies of our prod server. This lets us very quickly test specific virtual changes with an exact copy of our prod system.

You’re still sharing the same hardware, right? To test for performance, you’d have to get production fairly quiet to get what Jose is looking for if I understand him correctly.

1 Like

You can always spin one up in Azure or AWS and check it out if you really want to know, just sayin’ :wink:

The Cloud Team but then again, it’s SaaS. We don’t ask Microsoft if Exchange is using all the cores… :thinking:

Have a great weekend!!!

You can also run the PDT Tool with the following params to get more capabilities. But it works best with ATE.

/LoadTest /SQLDiag /Edge

1 Like

@Mark_Wonsil It’s all virtual so you can make your VM use anything that you would like as long as you actually have the physical cores and RAM available. You can also move it to another physical server and run it there as well.

1 Like

Meh! We had 2 x CPUs with alot of threads… MRP sucked, Epicor was slower… Changed it to 1 CPU with 8 threads and more Ghz… MRP went from 9hrs to 3hrs, despite using Threads in MRP Config.

Cisco Blades + VMWare

Even did a Health Check with Epicor and even brought someone from Cisco to verify all config… It was all up to best practice.

Epicors answer always was “I dunno”

Some recommendations from Epicor’s Health Check Team.

1 Like

I wonder if a slow MRP process (especially when using more threads) isn’t caused by:

  • Too Many Indexes on One Table
  • Too Many Fields in One Index
  • Too Few Indexes
  • Locking and Blocking (could be the reason why fewer threads are a lot faster)

Too Many Indexes on One Table: If you look at Epicor’s indexes there are, what seems like, “a lot” of Non-Clustered Indexes on one single table. The more non-clustered indexes you have on a table, the slower your inserts and deletes will go. If you have a table with 10 non-clustered indexes, that’s 10x (or more) writes an insert has to do for all of the data pages involved with each index. (Courtesy Brent Ozar)

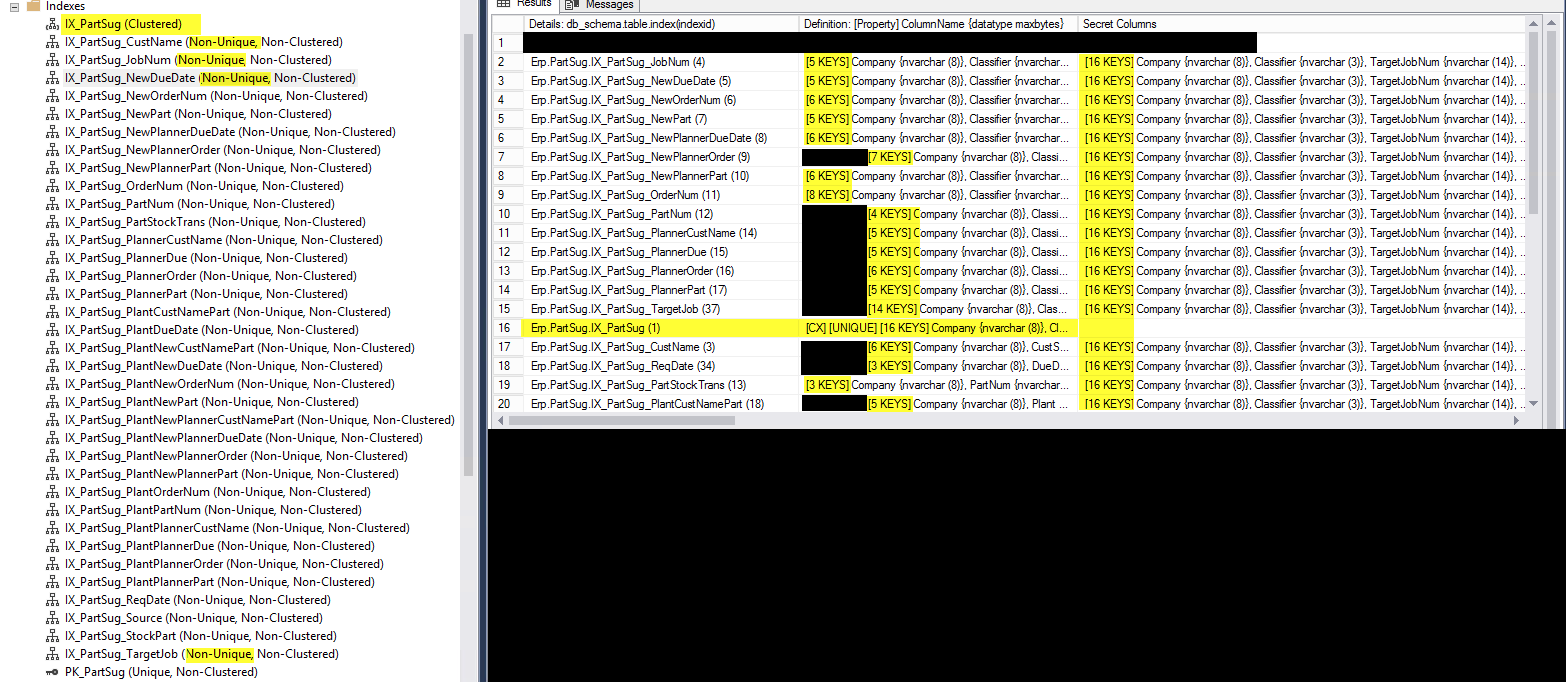
For the PartSug Table (this one causes us problems when we run MRP) there are 36 Indexes (35NC + 1CX):
image image
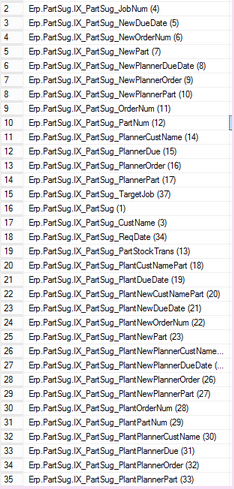
Can that be considered “a lot”? Brent Ozar has a 5 and 5 rule/suggestion (of course there are exceptions) but he usually recommends 5 indexes on a table and 5 columns per index.

Too Many Fields in One Index: The more columns you add to an index, the “heavier” (GB a page takes up and row count) that index gets. This is particularly important if writing to the table happens. The more indexes I add, the more work my writes have to do. The more columns are in each index, the more that gets magnified.

I hope I undersatnd this correctly but for the PartSug Table all of the Non-Clustered Indexes are Non-Unique which means that SQL Server will add all of the columns from the Clustering Key to the NC Index to make it unique. For this example, the Clustering Key of the Table includes all 16 Columns of the Clustered Index. All 16 of those columns are added to EACH NC Index (duplicates are removed if they are in the NC Index Keys) which means that each of the 35 NC Indexes have at least all 16 Clustered Index Columns in them. And any time any of these 16 Columns need to be changed or a new record added or deleted ALL of the NC Indexes need to be touched.

Locking Blocks: Locking and blocking is a normal and required activity in SQL Server. It happens when two processes (threads) need access to same piece of data concurrently so one process locks the data and the other one needs to wait for the first one to complete and release the lock. As soon as the first process is complete, the blocked process resumes operation. The blocking chain is like a queue: once the blocking process is complete, the next process can continue. In a normal server environment, infrequent blocking locks are acceptable. However, if we execute long, complex transactions that read lots of data, and take a long time to execute, then locks will be held for extended periods, and blocking can become a problem. When blocking occurs for extended time periods, it can impact the performance of many user processes. With blocking, however severe, no error is raised.

DeadLocks: (We are currently experience several Deadlocks on our PartSug table each time we run MRP.) Occurs when one process is blocked and waiting for a second process to complete its work and release locks, while the second process at the same time is blocked and waiting for the first process to release the lock. In a deadlock situation, the processes are already blocking each other so there needs to be an external intervention to resolve the deadlock. For that reason, SQL Server has a deadlock detection and resolution mechanism where one process needs to be chosen as the “deadlock victim” and killed so that the other process can continue working. The victim process receives a very specific error message indicating that it was chosen as a deadlock victim and therefore the process can be restarted.

I just wonder if Too many Indexes on one Table, Too many Fields on one Index and Locking and Blocking are what is slowing MRP down, especially when you have more than a few threads running at one time. In the PartSug example above, if a large number of threads are used to run MRP it could potentially mean that they are all trying to make changes to the 35 NC Indexes at one time. (And this is just ONE Table that I’m looking at!) And if you lower the amount of threads that MRP is running it doesn’t run into as many Locking and Blocking issues and it will run a lot faster. Just a theory of mine. I’m a newbie to all of this so I apologize if any of my information above is wrong and would be interested to know if anyone else has any additional ideas. Thanks! :slight_smile:

4 Likes

Absolutely. I think Epicor needs to hire a SQL Guru to really revamp their Indexes… I recall Epicor’s fix to PartSug for me was “Make a fake company and fill it with fake data to even the Page Fills”.

I do recall also JobAsmbl_UD breaking MRP because the page-fill and fragmentation was very high. I worked with Raj Tapde on forcing a 50% pagefill to get it to work again.

2 Likes

Good morning.

In 10.2.600.x there are several locking and blocking issues resolved. I am told by a senior MPR developer that the SUGGPO tables have 3 or 4 fixes in this release. So far my testing’s in 10.2.600.x have been extremely successful. We have been focusing more on just getting MRP to run without have a lot of abandons and SQL timeouts. Just as an example, our weekends regen had 18 of the 20 MRP processors abandon in the early levels.

In our testing using our current 10.2.600.7 environment that has two comparable servers as our productions servers, we can honestly say that MRP has not shown any error in the last 3 months. Now, I do know our current testing environment does not have the all-day beatings on it as our production servers has, however if I run MRP in 10.2.400.6 TEST with nobody on it, I would still get constant abandons.

We look forward to upgrading to 10.2.600.7 next month.

It would be great to hear what your MRP parameters are, your levels on BOMs, and the number unfirmed jobs you are creating. I see you are on 10.1.600.x. I do know there is a large fix released in that version, but I think it was 10.1.600.19 or so. 10.2.400 and up have been getting much better.

2 Likes

Indeed. But to be fair, if pushing stuff out in ud. But it shouldn’t break. If you look at alot of environments, there are some basic indexes that should be in place. But also saying that, it depends on the environment(hardware/config etc).