The Microsoft info on formatting SSRS reports is pretty lax.
Anyone have tips for making an SSRS report more Excel friendly?
My initial needs:
1. Reducing blank rows.
Using a Tablix as the whole body of the report makes that info pretty well behaved. But “multiple rows” in a header or footer, seem to always make blank rows in the resulting Excel file.
Even when I meticulously set the height and the position of each element, making sure all elements in a given “row” are top aligned, the same height, and set to cannot grow. I set the second “row” of elements to have their top equal to the top + height of the elements in the row above them.
2. Turn of "Wrap text"
When the contents of an element exceed its width, and Can Grow is true, the resulting cell in Excel has its height adjusted to fit, and its “Wrap Text” is enabled. Setting the Can Grow to false only keeps the Excel row from growing in height, but still has “Wrap text”.
3. Default the gridlines as visible.
You have to go to View \ Show and check the “Gridlines” box to see them.
4. Lining up Columns
Elements in the page header create odd columns, and force the columns from the Tablix to span more than one column, resulting in merged cells in Excel.
Setting the Pager Header’s elements property’s (location and size) to line up with the Tablix columns doesn’t seem to help.
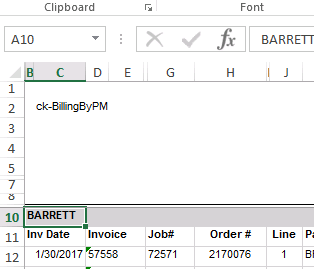
For example. The cell with “BARRETT” in it spans columns B and C. Same for “Inv Date” and all the rows with the actual invoice date in them. And I have no idea where Column A went.