I’m having a hard time getting help from Epicor support in regards to our license usage. This past week we had several users that couldn’t access the system as we had used all available Default licenses. I haven’t heard of this in quite some time(we bought more licenses a couple years back), so I’d like to see some data so we can understand who all had an active session when we ran out(was it a case of the perfect storm, was someone using multiple licenses, etc), and I’d like to be able to see this data with respect to time so we can make data driven decisions.
Our logs are verbose and include session and license information, so I’m fairly confident the data I’m looking for is in our log files which I have handy. The problem is I don’t fully understand the syntax of the log file, and it’s quite verbose so it’s not clear how to slice and dice it to see who was logged in when so I can get the data I’m after. I would think other companies would have a similiar need, so wanted to reach out to see how others have addressed this issue? Epicor supports recommendation was to login to the Epicor Admin Console and effectively poll it manually to collect the data we want(not an ideal solution…).
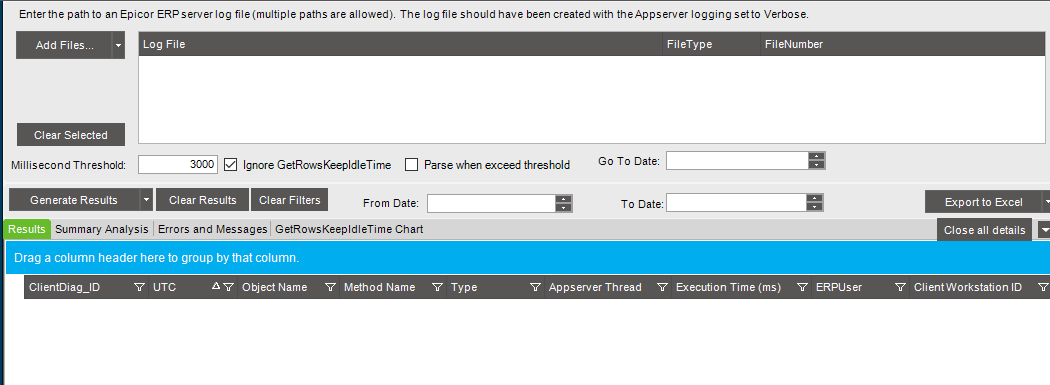
If you have the logs you can add them to the Performance and Diagnostics Tool (PDT) for a more excel friendly export, in addition it will convert UTC times to your specified timezone in PDT Settings.
You can schedule a PowerShell script to run this, evaluate the results (getting close to license limit, identify multiple log-ins by one person, etc.), log the result if you want to analyze the data, and then notify if necessary.
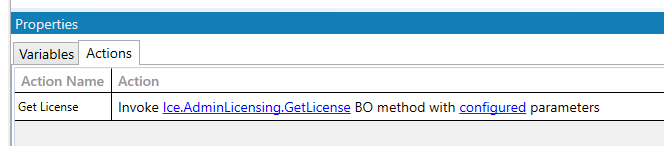
I made an Epicor Function that writes to a UD table every 30 seconds. Then I put it into Excel because I just have not had the motivation to make it an actual screen in Epicor, since only I care about this.
Funny, we all used different BOs/methods. This is the one I saw in the trace of the User Tracker screen.
Would it be simple to have the names of the sessions recorded to the UD table as well? This way (in Excel), you could filter to that time and retroactively see who was consuming the licenses.
Or tweak it to only dump that when >90% of open licenses are consumed, so the log file doesn’t grow too quickly.
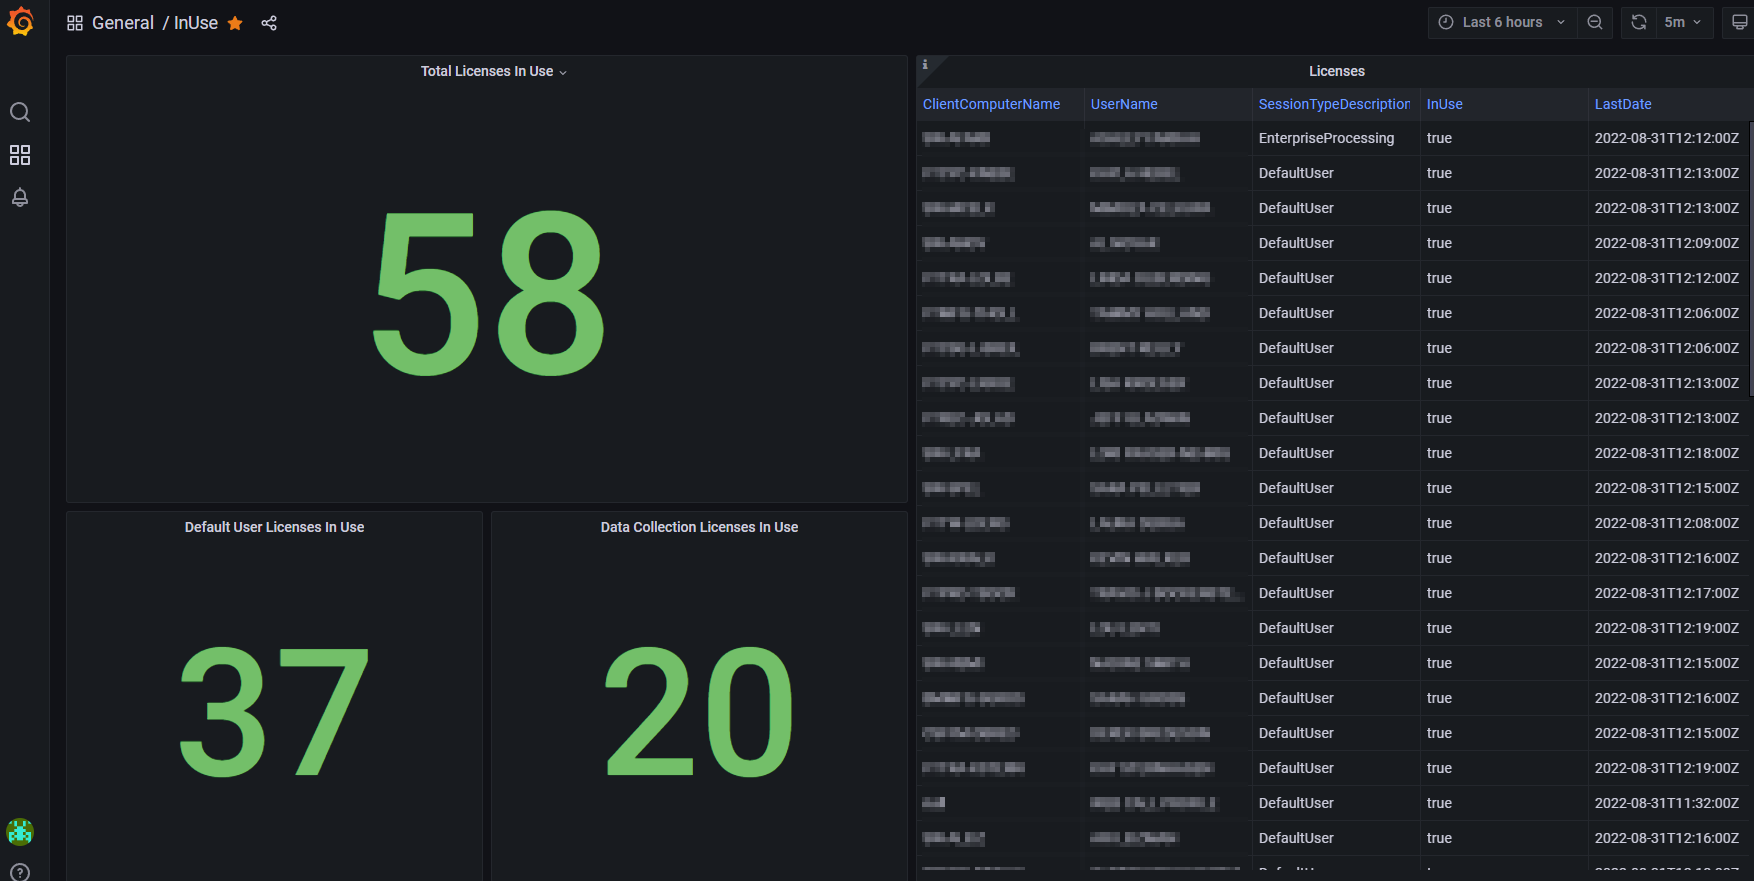
@SJenkins (our reporting guru) created a Grafana dashboard to do this:
This must be a different method. The one I used is just numbers. It’s already over 300k rows, I think, after 3-ish months. I haven’t deleted any data yet.
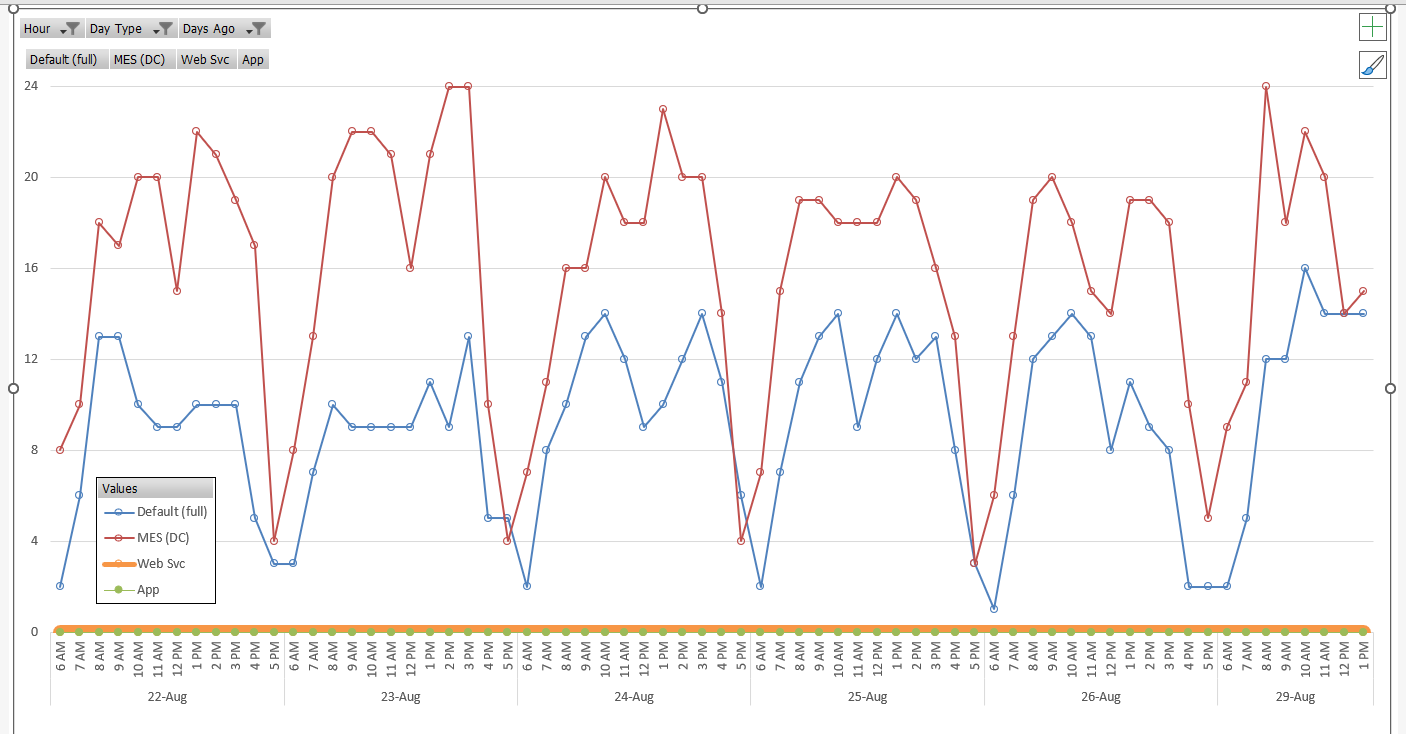
My use case was:
We were running out of default licenses
Determining if it was due to
a. An excess of MES/DC users that got kicked over to Default,
b. Or was it true default users
Deciding what additional licenses to buy. If the cause was 2a then we only needed more MES licenses. But if 2b then more default licenses.
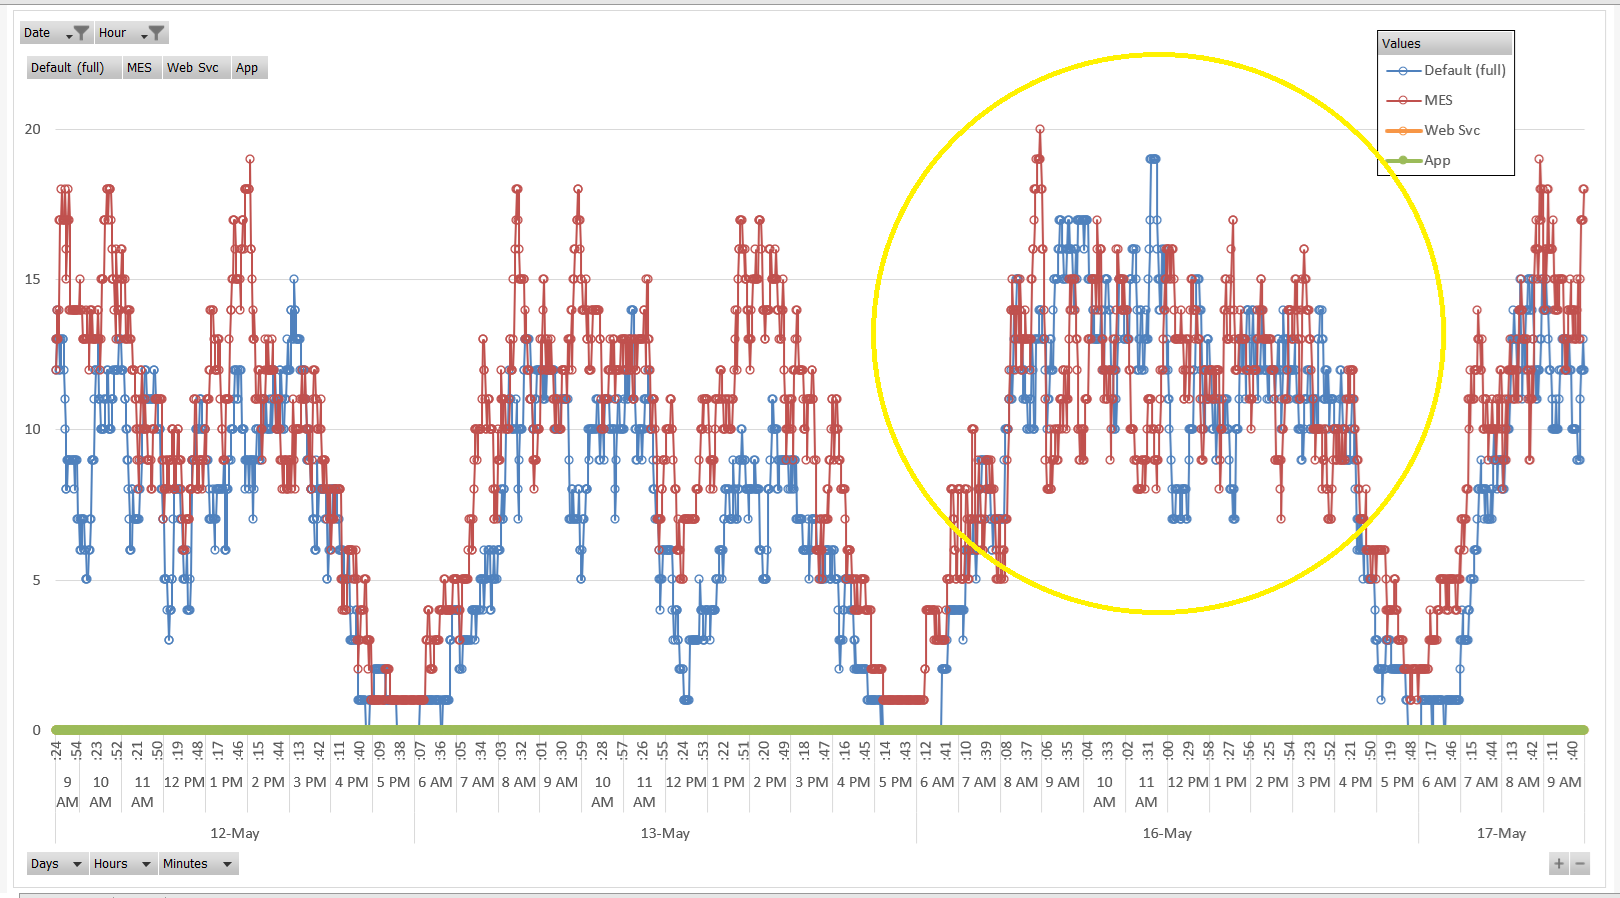
In the words of Shakespeare, it was not 2b.
I am intrigued by Grafana now.
Edit - This was a pic from May (before I had the sense to not show EVERY data point and instead just the max per hour).
We had 20 of each license type. My hunch was proven right, where we’d peg out the MES and then Defaults would climb. So we bought more MES and have been good since.