I’m working with a set of data to show our on hand quantity by site, using the PartWhse table. I’m attempting to pivot that data to show our sites as columns and the on hand values in rows. When I pivot it, I am getting three rows for each part number displaying an on hand value for a separate site on each line. IS there any way to combine these into a single row per line? What am I missing here?
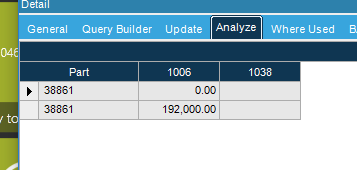
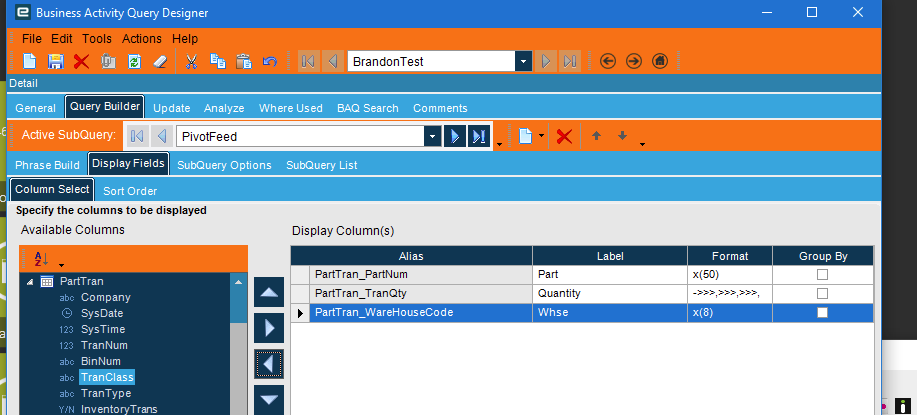
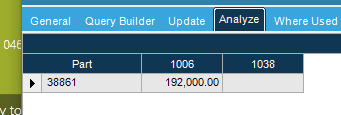
The pivot will work like a group by, and columns in the feeding subquery need to all be grouped. So if you have extra columns in the subquery, that will cause the rows to not correctly condense. (even if they aren’t displayed)
Here’s an example.
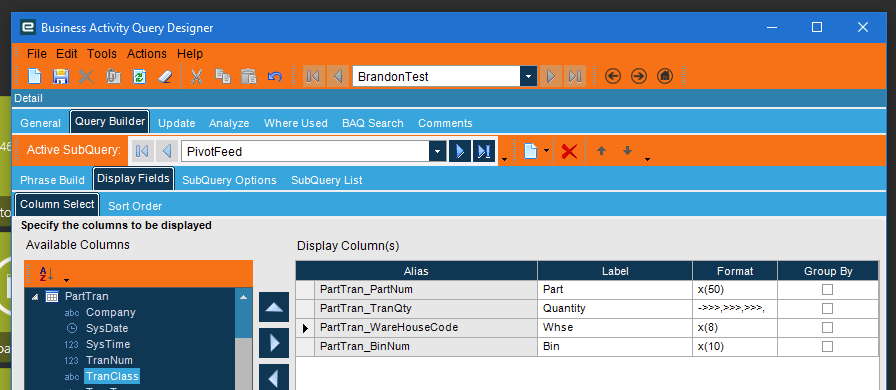
This is my subquery that feeds the pivot. I am pivoting on part number with warehouse transaction qty. I don’t care about BinNum in my final display, but I have it here.