Mfg Lead Time Calculation taking TOO long to run

Hi all,

Been scratching my head over this for a few weeks and Epicor support isn’t really helping on this.

I have a process set that runs every day at 5pm (automatically changed over to begin at 4pm since daylight savings kicked in) and as part of the process set, we first run mfg lead time calculation and then run process mrp. Process MRP should run ONLY after mfg lead time calculation is finished.

ALSO - I have noticed that mfg lead time calculation goes into an error state, with an end time matching the time when MRP starts running. However, mfg lead time calculation is still running while it is in error state! And then it finishes up and goes from error state to complete. This is what the error says in the system monitor.

We run manufacturing lead time every night since our constrained material settings are updated everyday and therefore new lead times are calculated for mfg parts.

Since last month, the time it takes to run in LIVE environment vs PILOT environment is quite different, despite the fact that we copied Live to Pilot last month. I can confirm that both live and pilot are running with the same settings.
image

Past few runs in LIVE:

Past few runs in PILOT:

You can see that it’s taking around ~10-12 hours in LIVE when it is running in only ~2 hours in Pilot.

I did some digging on the mfg logs for runs on 6th April and 7th April '25 , and put them in an excel spreadsheet for comparison, and found the following conclusion from my analysis on the runtime:

Pilot:
Total parts mfg lead time run on 6th April: 13,753
Total parts mfg lead time run on 7th April: 13,753
In one minute, Epicor is calculating the mfg lead time for 102 parts.


image

Live
Total parts mfg lead time run on 6th April: 28,019
OUT OF WHICH:
For 36 parts mfg lead time calculation ran 3 times
For 13,339 parts, mfg lead time calculation ran 2 times.
For 1,233 parts, mfg lead time calculation ran only once.
(UPDATE: After monitoring the logs excessively, I realized that we were writing logs for mfg lead time calculation from all of our Epicor environments (Live, Pilot and Test) into one log file, and hence why all parts were allegedly being calculated more than once. This narrows down the issue to just slow performance)

Total parts mfg lead time run on 7th April: 13,873 (0 parts where mfg lead time calculation was ran twice on)
In one minute, Epicor is calculating the mfg lead time for only 6 parts.

MRP heavily depends on the lead time that we put in Epicor to calculate the job due dates and I really need this fixed. I need mfg lead time calculation to be finished before I can run MRP and mfg lead time calculation is happening haphazardly. It shouldn’t be running for this long when it can be completed within 2 hours, as it is easily demonstrated in live.

Database related I’m guessing. Can your hosting company give you any insights into your production database server. Do you have any concurrent scheduled tasks that may be attempting to access/update the same tables the calc process is attempting to access/change

We had issues running the process without filtering it down when we had full recovery on a DB. Ran fine if we were in simple mode. I ended up running it based on product group over the weekends. This was back in 10.2 - I never tried a full run in Kinetic, but there have been other performance improvement with Kinetic so maybe this is better too?
Jenn

I’ve got access to the server - we’re on-premise. Anything in particular that I should be looking into? Not too sure what tables the calc process is attempting to access/change

Start with the basics, index fragmentation, It could be a bad cached query execution plan.

Do you run regular db maintenance?

Hey Simon,

Our MSP manages our DB for us, I wouldn’t be quite sure if they do any regular maintenance. I would suspect that there isn’t any maintenance apart from whatever are the standard system maintenance processes run by SSMS.

I ran the following query to check for index fragmentation:

SELECT 
    dbschemas.[name] AS [Schema],
    dbtables.[name] AS [Table],
    dbindexes.[name] AS [Index],
    indexstats.avg_fragmentation_in_percent,
    indexstats.page_count
FROM 
    sys.dm_db_index_physical_stats (DB_ID(), NULL, NULL, NULL, 'LIMITED') AS indexstats
INNER JOIN 
    sys.tables dbtables ON dbtables.[object_id] = indexstats.[object_id]
INNER JOIN 
    sys.schemas dbschemas ON dbtables.[schema_id] = dbschemas.[schema_id]
INNER JOIN 
    sys.indexes AS dbindexes ON dbindexes.[object_id] = indexstats.[object_id]
                                 AND indexstats.index_id = dbindexes.index_id
WHERE 
    indexstats.database_id = DB_ID()
    AND indexstats.page_count > 100
ORDER BY 
    indexstats.avg_fragmentation_in_percent DESC;

Results after running in Live (Top 100 only):

Schema Table Index avg_fragmentation_in_percent page_count
Erp PegSupMst PK_PegSupMst 99.82905983 585
Erp QuoteCnt IX_QuoteCnt_Name 99.61832061 262
Erp PartPlant_UD PK_PartPlant_UD 99.61685824 783
Erp PartPlant IX_PartPlant_SysIndex 99.61389961 777
Erp CustXPrt IX_CustXPrt_SourceDBRecid 99.56772334 2082
Erp JobHead_UD PK_JobHead_UD 99.53632148 647
Erp BROperation IX_BROperation_SysIndex 99.52606635 422
Erp PartQty IX_PartQty_SysIndex 99.47780679 383
Erp PegDmdMst PK_PegDmdMst 99.47322212 1139
Erp QuoteOpr PK_QuoteOpr 99.44636678 1445
Erp APInvDtl IX_APInvDtl_SysIndex 99.44572748 2165
Erp JobAsmbl PK_JobAsmbl 99.43955164 1249
Erp PartWip IX_PartWip_SysIndex 99.42886812 5778
Erp MtlQueue PK_MtlQueue 99.39707149 1161
Erp ECORev IX_ECORev_PartRevAlt 99.38223938 1295
Erp ECORev IX_ECORev_PartRevParentAlt 99.38223938 1295
Ice ZKeyField PK_ZKeyField 99.375 320
Erp Local001 IX_Local001_Sysindex 99.37238494 5736
Erp QuoteHedTax IX_QuoteHedTax_SysIndex 99.36908517 317
Erp APInvHed IX_APInvHed_SysIndex 99.36507937 945
Erp InvcDtl IX_InvcDtl_SysIndex 99.36210131 2665
Erp OrderHed IX_OrderHed_SysIndex 99.36061381 782
Erp PerConLnk IX_PerConLnk_ContextLink 99.35064935 154
Erp OrderSched IX_OrderSched_SysIndex 99.33333333 900
Erp CashBDtl IX_CashBDtl_SysIndex 99.31034483 580
Erp CurrExChain IX_CurrExChain_SysIndex 99.30394432 19826
Erp PcMtlChg IX_PcMtlChg_SysIndex 99.30037313 2144
Erp ContainerDetail IX_ContainerDetail_SysIndex 99.29078014 423
Erp ShipDtl_UD PK_ShipDtl_UD 99.28961749 1830
Erp QuoteOpDtl PK_QuoteOpDtl 99.28664073 1542
Erp PODetail IX_PODetail_SysIndex 99.28507596 1119
Erp ShopCap PK_ShopCap 99.28057554 417
Erp MtlQueue IX_MtlQueue_PlantPart 99.27963327 1527
Erp PerCon IX_PerCon_Email 99.27536232 138
Erp QuoteMtl IX_QuoteMtl_SysIndex 99.27378359 1377
Erp ECORev IX_ECORev_Method 99.2706054 1371
Erp PartWhse IX_PartWhse_SysIndex 99.26677947 1773
Erp PriceLstParts IX_PriceLstParts_SysIndex 99.26624738 954
Erp ShipTo IX_ShipTo_NameNum 99.26470588 136
Erp GLJrnDtl IX_GLJrnDtl_SysIndex 99.26381047 36132
Erp CustXPrt IX_CustXPrt_SysIndex 99.26362297 2037
Erp JobAsmbl IX_JobAsmbl_CopyLIst 99.26025555 1487
Ice XFileAttch IX_XFileAttch_ForeignSysRowID 99.25933764 9451
Erp CCDtl IX_CCDtl_SysIndex 99.25280199 1606
Ice SysActivityLog IX_SysActivityLog_SysIndex 99.24928812 27041
Erp ECOOpr PK_ECOOpr 99.24692826 5046
Erp ARBalance IX_ARBalance 99.24533997 13251
Erp QuoteDtl IX_QuoteDtl_SysIndex 99.24406048 1852
Ice ZLookupField IX_ZLookupField_SysIndex 99.24242424 132
Ice XFileRef IX_XFileRef_SysIndex 99.24194567 3166
Erp JobMtl PK_JobMtl 99.24096053 7246
Erp TranGLC PK_TranGLC 99.23920941 163777
Erp QuoteDtl_UD PK_QuoteDtl_UD 99.23503034 3791
Ice BitFlag IX_BitFlag_SysIndex 99.23376113 300298
Erp PartAudit PK_PartAudit 99.23371648 4176
Erp VendPart IX_VendPart_PtCurDtVen 99.23312883 652
Ice LangXref IX_LangXref_SysIndex 99.23264084 5343
Erp ARMovement IX_ARMovement_SysIndex 99.23047326 2599
Erp QuoteHed_UD PK_QuoteHed_UD 99.22566372 1808
Ice XFileAttch IX_XFileAttch_SysIndex 99.22398927 10438
Erp OrderHed_UD PK_OrderHed_UD 99.22229423 1543
Erp RcvHead_UD PK_RcvHead_UD 99.22077922 385
Erp ShopWrn IX_ShopWrn_SysIndex 99.21881935 11265
Erp ShipDtl IX_ShipDtl_SysIndex 99.21599373 2551
Erp OrderRelTax IX_OrderRelTax_SysIndex 99.21414538 3563
Erp GLPeriodBal IX_GLPeriodBal_SysIndex 99.21328671 1144
Erp PartMtl PK_PartMtl 99.21164342 1649
Erp CustXPrt IX_CustXPrt_XPartNum 99.20634921 2016
Erp NACreditDoc PK_NACreditDoc 99.20603015 9950
Erp PartTran_UD PK_PartTran_UD 99.19833292 40790
Erp JobPart PK_JobPart 99.19624916 1493
Erp InvcTax IX_InvcTax_SysIndex 99.19549477 3729
Ice XFileAttch PK_XFileAttch 99.18478261 20976
Ice ChgLog IX_ChgLog_SysIndex 99.18441893 405723
Erp APInvExp IX_APInvExp_SysIndex 99.18157017 3299
Erp QuoteHed IX_QuoteHed_SysIndex 99.18032787 366
Erp PartAudit IX_PartAudit 99.17869587 8036
Erp ECORev IX_ECORev_SearchWord 99.1751269 1576
Erp PartBin IX_PartBin_IDXPartBinWhse 99.17355372 242
Erp PartUOM IX_PartUOM_SysIndex 99.17250159 6284
Erp JobHead PK_JobHead 99.17050691 1085
Erp PartRevDt PK_PartRevDt 99.16963227 843
Erp PartTran PK_PartTran 99.1683385 27415
Erp Task IX_Task_SysIndex 99.16527546 599
Erp JobAsmbl IX_JobAsmbl_WhsePart 99.16398714 1555
Erp PegLink IX_PegLink_SysIndex 99.16201117 358
Ice UD01 IX_UD01_SysIndex 99.16040654 2263
Ice ZLinkColumn IX_ZLinkColumn_SysIndex 99.15966387 119
Erp PartXRefVend IX_PartXRefVend_SysIndex 99.15966387 119
Ice SysTaskParam IX_SysTaskParam_SysIndex 99.15827996 10930
Erp ARBalance PK_ARBalance 99.15524386 6274
Erp JobAsmbl IX_JobAsmbl_CmplPart 99.15433404 1419
Erp InvcHead IX_InvcHead_SysIndex 99.15182358 1179
Erp TaxBoxTran IX_TaxBoxTran_SysIndex 99.13858979 14395
Erp JobPart IX_JobPart_ClosedPlantPart 99.13544669 1388
Erp RcvDtl IX_RcvDtl_SysIndex 99.12935323 1608
Erp EntityGLC IX_EntityGLC_SysIndex 99.12595249 4462
Ice UD01_UD PK_UD01_UD 99.12339852 1483
Erp PartOpDtl IX_PartOpDtl_SysIndex 99.12280702 1254

Results after running in Pilot (Top 100 only):

Schema Table Index avg_fragmentation_in_percent page_count
Erp PartPlant_UD PK_PartPlant_UD 99.61685824 783
Erp PartPlant IX_PartPlant_SysIndex 99.61389961 777
Erp QuoteCnt IX_QuoteCnt_Name 99.60784314 255
Erp CustXPrt IX_CustXPrt_SourceDBRecid 99.56772334 2082
Erp JobHead_UD PK_JobHead_UD 99.5447648 659
Erp BROperation IX_BROperation_SysIndex 99.52606635 422
Erp PPlanMtl IX_PPlanMtl 99.51690821 207
Erp APInvDtl IX_APInvDtl_SysIndex 99.48717949 2145
Erp PartQty IX_PartQty_SysIndex 99.47780679 383
Erp QuoteHed IX_QuoteHed_SysIndex 99.44751381 362
Erp QuoteOpr PK_QuoteOpr 99.43422914 1414
Erp PartWip IX_PartWip_SysIndex 99.42618675 5751
Erp MtlQueue PK_MtlQueue 99.39130435 1150
Erp ECORev IX_ECORev_PartRevAlt 99.38176198 1294
Erp ECORev IX_ECORev_PartRevParentAlt 99.38176198 1294
Ice ZKeyField PK_ZKeyField 99.375 320
Erp Local001 IX_Local001_Sysindex 99.37238494 5736
Erp InvcDtl IX_InvcDtl_SysIndex 99.36138242 2662
Erp OrderHed IX_OrderHed_SysIndex 99.35979513 781
Erp APInvHed IX_APInvHed_SysIndex 99.35965848 937
Erp JobAsmbl PK_JobAsmbl 99.35897436 1248
Erp QuoteHedTax IX_QuoteHedTax_SysIndex 99.3442623 305
Erp ECORev IX_ECORev_Method 99.34306569 1370
Erp QuoteOpDtl PK_QuoteOpDtl 99.33730948 1509
Erp PerConLnk IX_PerConLnk_ContextLink 99.33333333 150
Erp QuoteMtl IX_QuoteMtl_SysIndex 99.33184855 1347
Erp OrderSched IX_OrderSched_SysIndex 99.32735426 892
Erp CurrExChain IX_CurrExChain_SysIndex 99.32349323 19512
Erp CashBDtl IX_CashBDtl_SysIndex 99.31034483 580
Erp PartDtl IX_PartDtl_SysIndex 99.3006993 429
Erp QuoteDtl IX_QuoteDtl_SysIndex 99.29000546 1831
Erp ShipDtl_UD PK_ShipDtl_UD 99.28922909 1829
Erp ContainerDetail IX_ContainerDetail_SysIndex 99.28741093 421
Erp PODetail IX_PODetail_SysIndex 99.28507596 1119
Erp ShopCap PK_ShopCap 99.28057554 417
Erp MtlQueue IX_MtlQueue_PlantPart 99.27055703 1508
Erp PerCon IX_PerCon_Email 99.27007299 137
Erp PartWhse IX_PartWhse_SysIndex 99.26677947 1773
Erp JobPart PK_JobPart 99.26666667 1500
Erp PriceLstParts IX_PriceLstParts_SysIndex 99.26624738 954
Ice XFileRef IX_XFileRef_SysIndex 99.26517572 3130
Erp GLJrnDtl IX_GLJrnDtl_SysIndex 99.26381047 36132
Erp CustXPrt IX_CustXPrt_SysIndex 99.26362297 2037
Erp ECOOpr PK_ECOOpr 99.26280135 5019
Erp ShipTo IX_ShipTo_NameNum 99.25925926 135
Erp ARBalance IX_ARBalance 99.25356082 13129
Erp CCDtl IX_CCDtl_SysIndex 99.25280199 1606
Ice XFileAttch IX_XFileAttch_ForeignSysRowID 99.24395698 9391
Ice ZLookupField IX_ZLookupField_SysIndex 99.24242424 132
Ice SysActivityLog IX_SysActivityLog_SysIndex 99.24210687 26257
Erp TranGLC PK_TranGLC 99.23613458 162725
Erp JobMtl PK_JobMtl 99.23277161 7299
Ice LangXref IX_LangXref_SysIndex 99.23235349 5341
Erp QuoteDtl_UD PK_QuoteDtl_UD 99.23178808 3775
Erp VendPart IX_VendPart_PtCurDtVen 99.22958398 649
Erp ARMovement IX_ARMovement_SysIndex 99.22898998 2594
Erp OrderHed_UD PK_OrderHed_UD 99.22229423 1543
Ice XFileAttch IX_XFileAttch_SysIndex 99.22227556 10415
Erp PegLink IX_PegLink_SysIndex 99.22178988 514
Erp RcvHead_UD PK_RcvHead_UD 99.22077922 385
Erp ShopWrn IX_ShopWrn_SysIndex 99.22056979 11162
Ice BitFlag IX_BitFlag_SysIndex 99.22025726 299073
Erp InvcTax IX_InvcTax_SysIndex 99.22022049 3719
Erp PartAudit PK_PartAudit 99.21855922 4095
Erp ShipDtl IX_ShipDtl_SysIndex 99.21599373 2551
Erp QuoteHed_UD PK_QuoteHed_UD 99.21392476 1781
Erp PartMtl PK_PartMtl 99.21164342 1649
Erp PegSupMst PK_PegSupMst 99.21135647 634
Erp GLPeriodBal IX_GLPeriodBal_SysIndex 99.20983319 1139
Erp JobAsmbl IX_JobAsmbl_CopyLIst 99.20687376 1513
Erp APInvExp IX_APInvExp_SysIndex 99.20683344 3278
Erp CustXPrt IX_CustXPrt_XPartNum 99.20634921 2016
Erp NACreditDoc PK_NACreditDoc 99.20595035 9949
Erp PartTran_UD PK_PartTran_UD 99.19833292 40790
Ice ChgLog IX_ChgLog_SysIndex 99.1842274 402318
Erp OrderRelTax IX_OrderRelTax_SysIndex 99.18148462 3543
Erp ARBalance PK_ARBalance 99.17953668 6216
Erp ECORev IX_ECORev_SearchWord 99.1751269 1576
Erp PartBin IX_PartBin_IDXPartBinWhse 99.17355372 242
Erp PartUOM IX_PartUOM_SysIndex 99.17250159 6284
Ice SysTaskParam IX_SysTaskParam_SysIndex 99.17172833 10866
Erp PartRevDt PK_PartRevDt 99.16963227 843
Erp PartAudit IX_PartAudit 99.16845156 7937
Erp JobAsmbl IX_JobAsmbl_CmplPart 99.16317992 1434
Ice ZLinkColumn IX_ZLinkColumn_SysIndex 99.15966387 119
Erp PartXRefVend IX_PartXRefVend_SysIndex 99.15966387 119
Erp Task IX_Task_SysIndex 99.15397631 591
Ice XFileAttch PK_XFileAttch 99.1522158 20760
Erp InvcHead IX_InvcHead_SysIndex 99.15038233 1177
Erp PartTran PK_PartTran 99.15009042 27650
Erp PegDmdMst IX_PegDmdMst_SysIndex 99.14346895 467
Erp TaxBoxTran IX_TaxBoxTran_SysIndex 99.13667061 14363
Erp InvcSched IX_InvcSched_SysIndex 99.13657771 1274
Erp ECOCOPart IX_ECOCOPart_SysIndex 99.13366337 2424
Erp PcMtlChg IX_PcMtlChg_SysIndex 99.13087935 1956
Erp JobProd PK_JobProd 99.12706111 2062
Erp RcvDtl IX_RcvDtl_SysIndex 99.12663755 1603
Erp CostPart IX_CostPart_SysIndex 99.12591543 12699
Ice UD01_UD PK_UD01_UD 99.12516824 1486

I am not a database admin but I think that 99% is not a good number. However, if this was really the issue then I would have expected a different outcome in Pilot since mfg lead time calculation seems to be working fine there?

They say anything over 30 is suboptimal, but as you pointed out live and pilot look similar, what about table row counts, when was Pilot refreshed with live is what I am really asking.

Is it possible that there is a bad manufacturing lead time entry, like
an unprintable character?

How do I check if there is any bad manufacturing lead time entry?

This is the data from Live and Pilot for comparison. This was refreshed a month ago. Based on Epicor support’s advice, I am copying Live to Pilot again and then going to run mfg lead time calculation and review if there are any dramas.

PILOT (Before Copy) PILOT (After Copy) LIVE
PartRev 39,212.00 TBD 39,275.00
PartMtl 107,353.00 TBD 107,655.00
PartOpr 69,353.00 TBD 69,617.00
1 Like

Okay, it seems like this is a problem specific to the live environment.

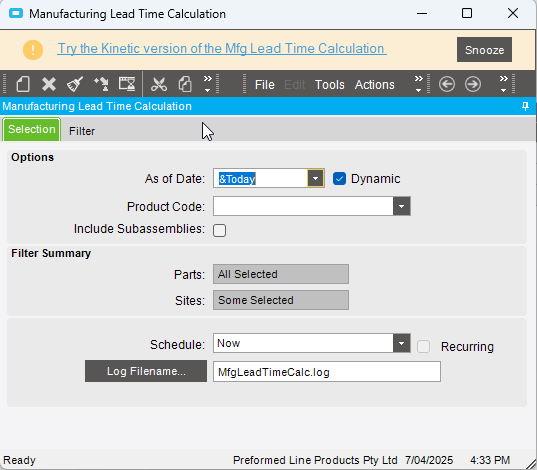
I copied Live over to Pilot and ran mfg lead time calculation again.

Results:
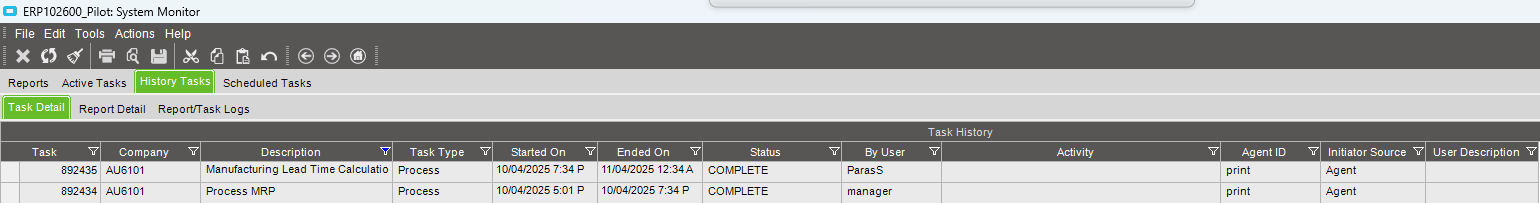
Pilot - mfg lead time calculation took 5 hours exact.

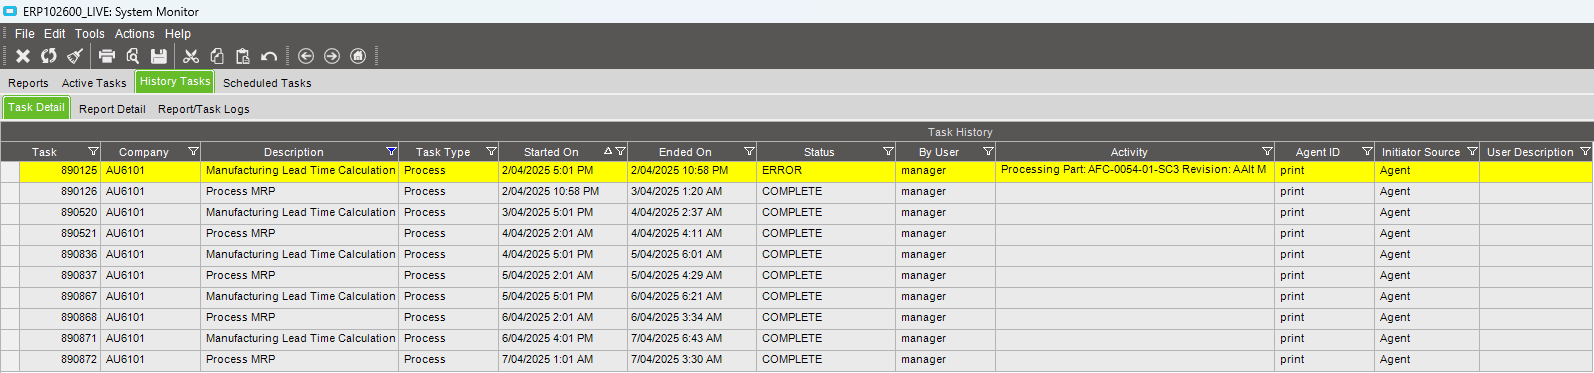
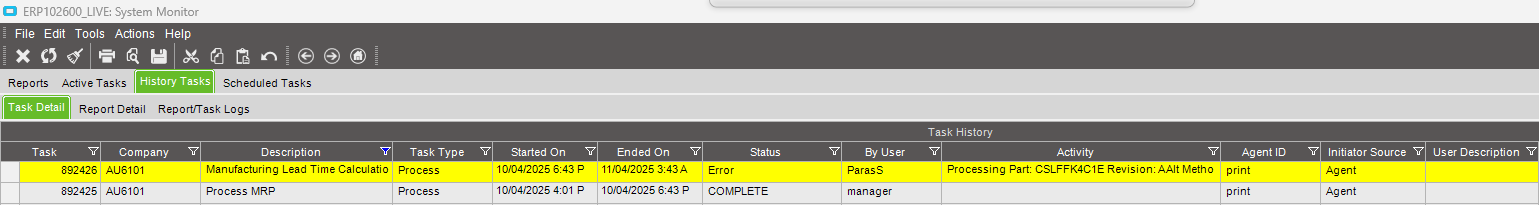
Live - mfg lead time calculation started at 6:43PM yesterday, went into an error state (apparently) at 3:43AM, but is still executing as of 9:08AM


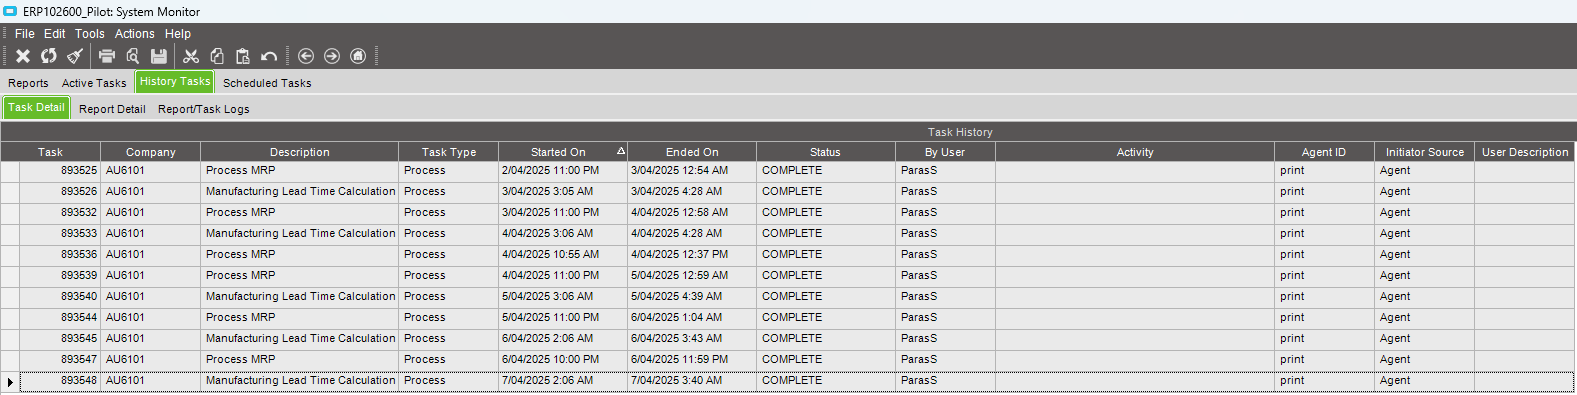
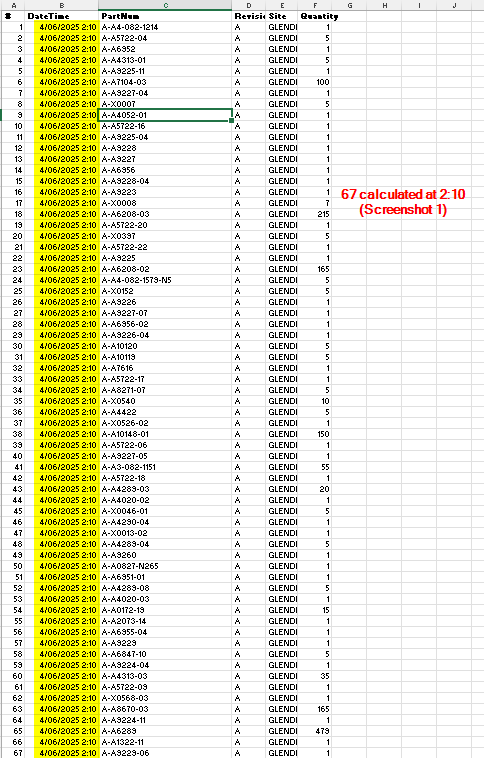
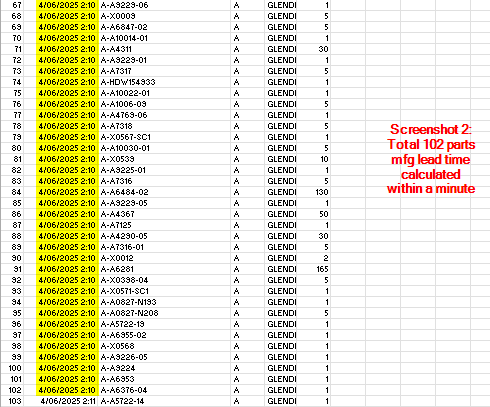
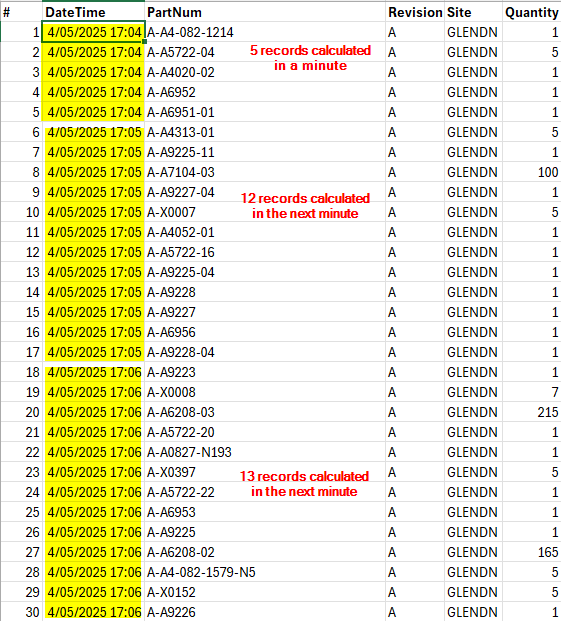
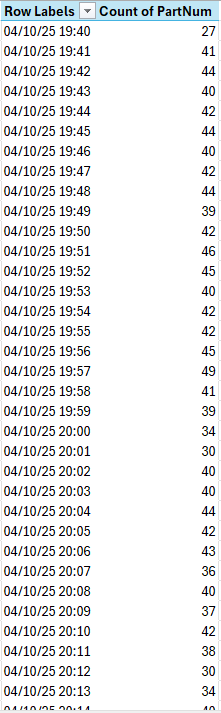
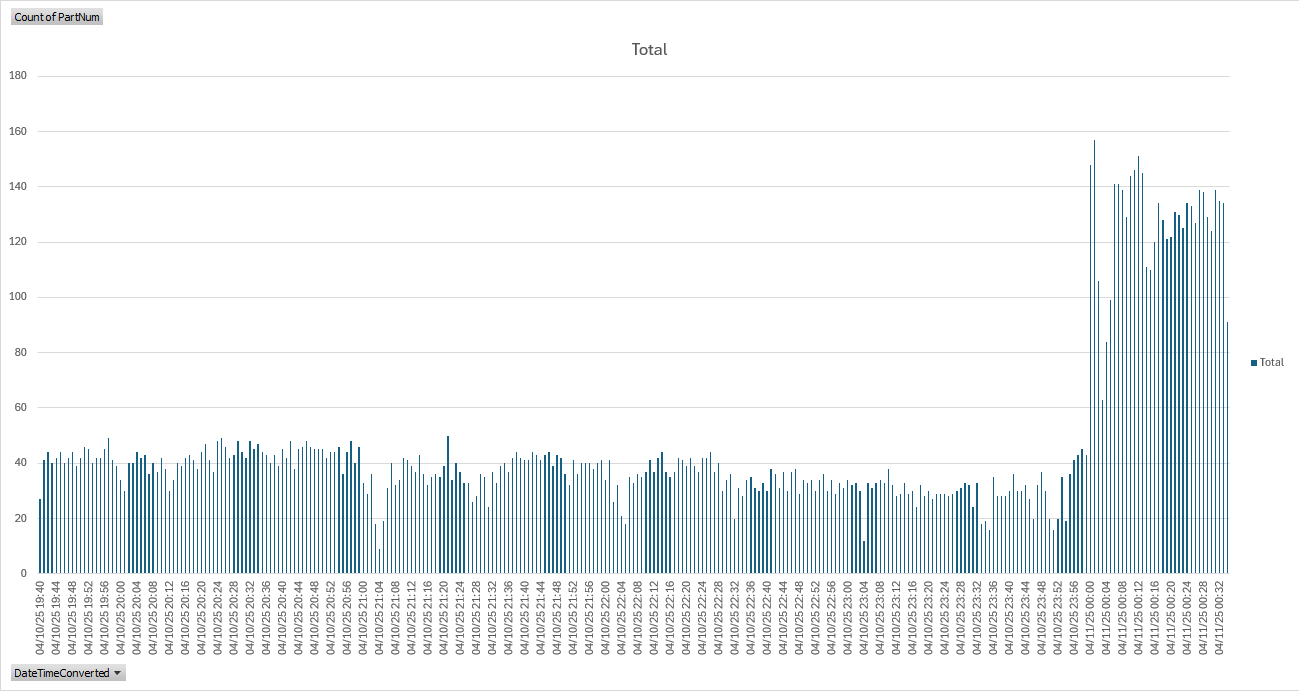
I did an analysis to see if there are any parts that are taking too long to calculate. It just stands out that the number of parts calculated per minute are more in Pilot compared to Live. Even though they’re running the exact same process.

Pilot on average calculating around 47 parts per minute.


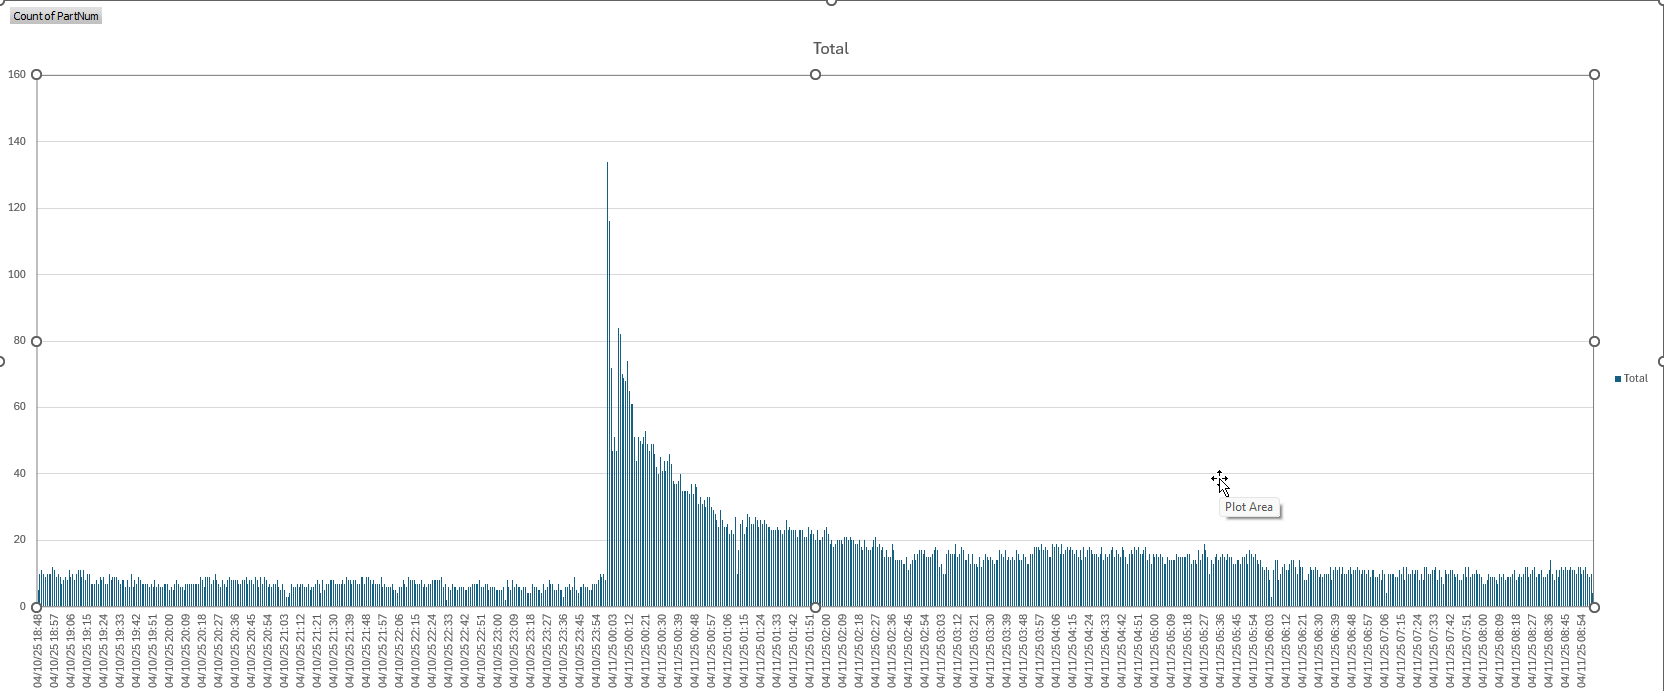
Live on average calculating around 14 parts per minute, but I can see that the distribution is quite sporadic.

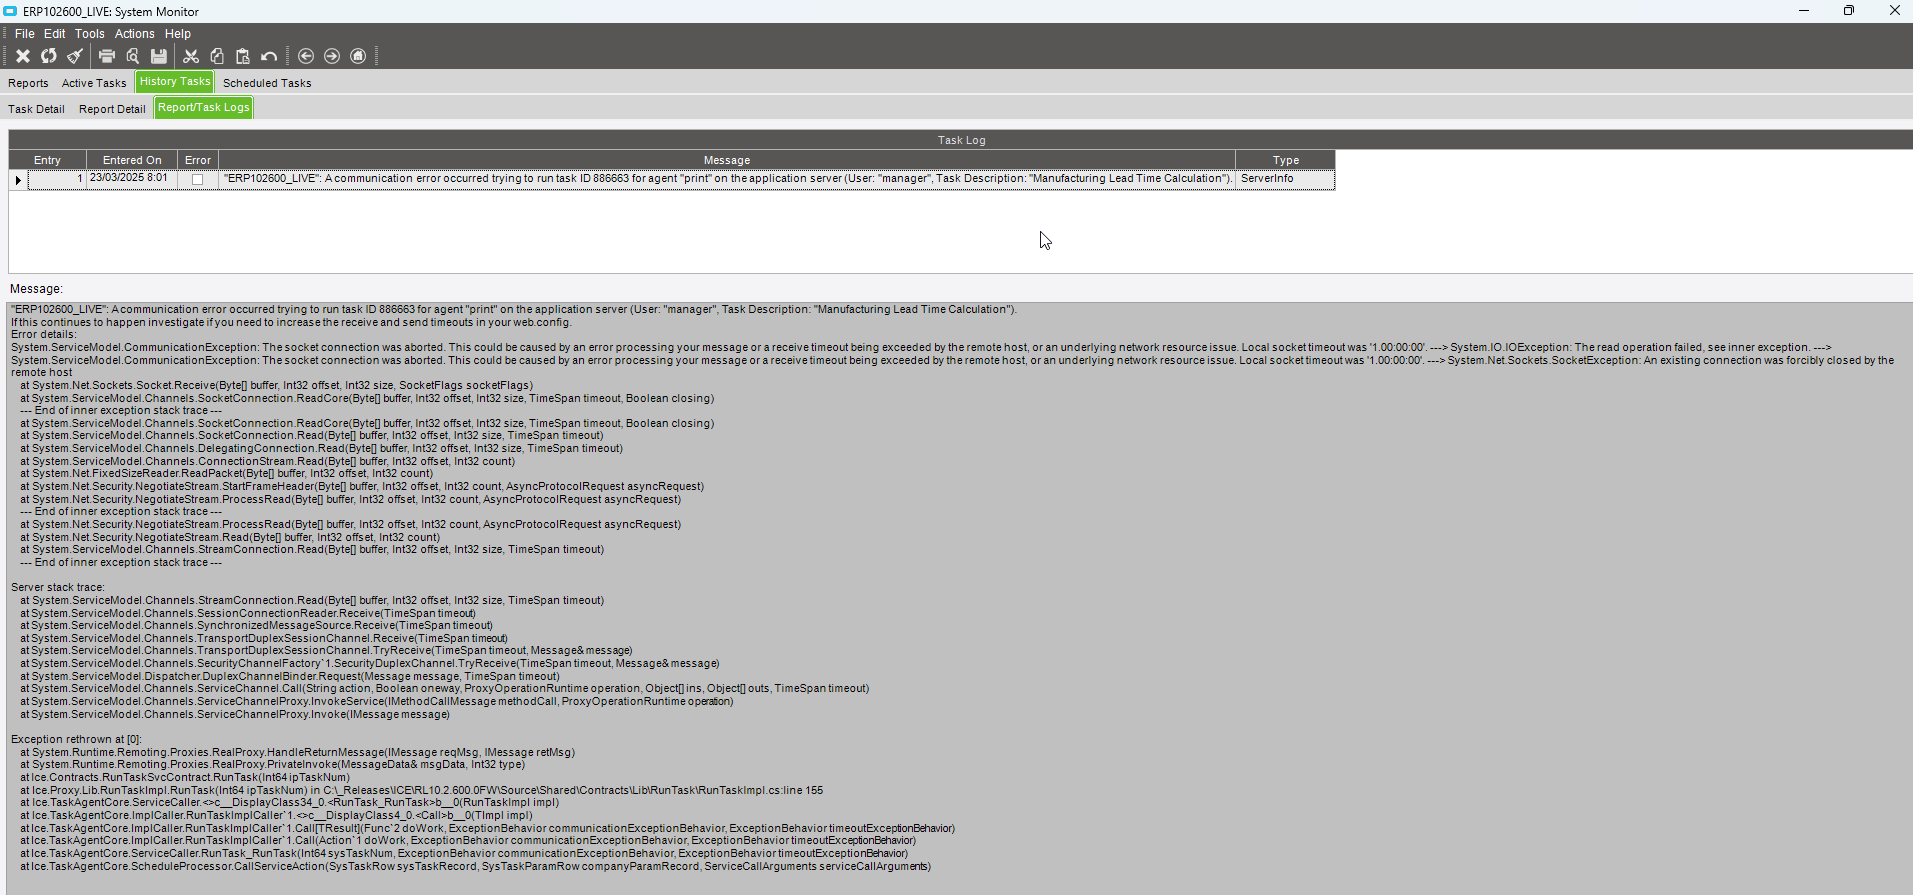
The only thing that stands out is the error message in windows server event viewer logs for the ICE Task Agent exactly at 3:43 am when the process goes into error in the system monitor.
Error message is:

- <Event xmlns="http://schemas.microsoft.com/win/2004/08/events/event">
- <System>
  <Provider Name="EpicorTaskAgent3.2.600.0" /> 
  <EventID Qualifiers="0">215</EventID> 
  <Level>2</Level> 
  <Task>0</Task> 
  <Keywords>0x80000000000000</Keywords> 
  <TimeCreated SystemTime="2025-04-10T17:43:46.584545200Z" /> 
  <EventRecordID>7170168</EventRecordID> 
  <Channel>Epicor ICE Task Agent Service</Channel> 
  <Computer>PLPE10SVR.preformed.com.au</Computer> 
  <Security /> 
  </System>
- <EventData>
  <Data>"ERP102600_LIVE": A communication error occurred trying to run task ID 892426 for agent "print" on the application server (User: "ParasS", Task Description: "Manufacturing Lead Time Calculation"). If this continues to happen investigate if you need to increase the receive and send timeouts in your web.config. Error details: System.ServiceModel.CommunicationException: The socket connection was aborted. This could be caused by an error processing your message or a receive timeout being exceeded by the remote host, or an underlying network resource issue. Local socket timeout was '23:59:59.9990000'. ---> System.IO.IOException: The read operation failed, see inner exception. ---> System.ServiceModel.CommunicationException: The socket connection was aborted. This could be caused by an error processing your message or a receive timeout being exceeded by the remote host, or an underlying network resource issue. Local socket timeout was '23:59:59.9990000'. ---> System.Net.Sockets.SocketException: An existing connection was forcibly closed by the remote host at System.Net.Sockets.Socket.Receive(Byte[] buffer, Int32 offset, Int32 size, SocketFlags socketFlags) at System.ServiceModel.Channels.SocketConnection.ReadCore(Byte[] buffer, Int32 offset, Int32 size, TimeSpan timeout, Boolean closing) --- End of inner exception stack trace --- at System.ServiceModel.Channels.SocketConnection.ReadCore(Byte[] buffer, Int32 offset, Int32 size, TimeSpan timeout, Boolean closing) at System.ServiceModel.Channels.SocketConnection.Read(Byte[] buffer, Int32 offset, Int32 size, TimeSpan timeout) at System.ServiceModel.Channels.DelegatingConnection.Read(Byte[] buffer, Int32 offset, Int32 size, TimeSpan timeout) at System.ServiceModel.Channels.ConnectionStream.Read(Byte[] buffer, Int32 offset, Int32 count) at System.Net.FixedSizeReader.ReadPacket(Byte[] buffer, Int32 offset, Int32 count) at System.Net.Security.NegotiateStream.StartFrameHeader(Byte[] buffer, Int32 offset, Int32 count, AsyncProtocolRequest asyncRequest) at System.Net.Security.NegotiateStream.ProcessRead(Byte[] buffer, Int32 offset, Int32 count, AsyncProtocolRequest asyncRequest) --- End of inner exception stack trace --- at System.Net.Security.NegotiateStream.ProcessRead(Byte[] buffer, Int32 offset, Int32 count, AsyncProtocolRequest asyncRequest) at System.Net.Security.NegotiateStream.Read(Byte[] buffer, Int32 offset, Int32 count) at System.ServiceModel.Channels.StreamConnection.Read(Byte[] buffer, Int32 offset, Int32 size, TimeSpan timeout) --- End of inner exception stack trace --- Server stack trace: at System.ServiceModel.Channels.StreamConnection.Read(Byte[] buffer, Int32 offset, Int32 size, TimeSpan timeout) at System.ServiceModel.Channels.SessionConnectionReader.Receive(TimeSpan timeout) at System.ServiceModel.Channels.SynchronizedMessageSource.Receive(TimeSpan timeout) at System.ServiceModel.Channels.TransportDuplexSessionChannel.Receive(TimeSpan timeout) at System.ServiceModel.Channels.TransportDuplexSessionChannel.TryReceive(TimeSpan timeout, Message& message) at System.ServiceModel.Channels.SecurityChannelFactory`1.SecurityDuplexChannel.TryReceive(TimeSpan timeout, Message& message) at System.ServiceModel.Dispatcher.DuplexChannelBinder.Request(Message message, TimeSpan timeout) at System.ServiceModel.Channels.ServiceChannel.Call(String action, Boolean oneway, ProxyOperationRuntime operation, Object[] ins, Object[] outs, TimeSpan timeout) at System.ServiceModel.Channels.ServiceChannelProxy.InvokeService(IMethodCallMessage methodCall, ProxyOperationRuntime operation) at System.ServiceModel.Channels.ServiceChannelProxy.Invoke(IMessage message) Exception rethrown at [0]: at System.Runtime.Remoting.Proxies.RealProxy.HandleReturnMessage(IMessage reqMsg, IMessage retMsg) at System.Runtime.Remoting.Proxies.RealProxy.PrivateInvoke(MessageData& msgData, Int32 type) at Ice.Contracts.RunTaskSvcContract.RunTask(Int64 ipTaskNum) at Ice.Proxy.Lib.RunTaskImpl.RunTask(Int64 ipTaskNum) in C:\_Releases\ICE\RL10.2.600.0FW\Source\Shared\Contracts\Lib\RunTask\RunTaskImpl.cs:line 155 at Ice.TaskAgentCore.ServiceCaller.<>c__DisplayClass34_0.<RunTask_RunTask>b__0(RunTaskImpl impl) at Ice.TaskAgentCore.ImplCaller.RunTaskImplCaller`1.<>c__DisplayClass4_0.<Call>b__0(TImpl impl) at Ice.TaskAgentCore.ImplCaller.RunTaskImplCaller`1.Call[TResult](Func`2 doWork, ExceptionBehavior communicationExceptionBehavior, ExceptionBehavior timeoutExceptionBehavior) at Ice.TaskAgentCore.ImplCaller.RunTaskImplCaller`1.Call(Action`1 doWork, ExceptionBehavior 

Look at the very last line of the passage - under .
Socket connection aborted…network issue?

I asked the IT team that is responsible for the virtualization of servers about this and they told me that they don’t know how to debug it. They told us that it’s more of an Epicor issue - especially since live and pilot are on the same server and live seems to have an issue while pilot doesn’t.

What do you reckon can be done to debug this?

What are your SQL backup settings between the 2 environments? We ran into this and traced it back to simple mode in our test environment versus full with our live environment. The logging was what caused our issue.
Jenn