Hello again, I am posting again because after a year of using epicor I still do not understand the logic behind data definition reports. I can’t seem to find anything that explains the logic behind which fields in a table should not be excluded. Obviously, I need to include the field I want to add to my reports, but from what I have seen in examples, other fields that are not being added to the report are being excluded.
Also Report Relationships make no sense either. I have been trying to understand this as well but nothing seems to work. Which field do I include as a link between two tables and why? How do multiple tables get linked together? If anyone could explain how these functions are meant to work, I was hoping it could be a great resource for me and others troubleshooting ssrs reports. Thanks!
Rule of thumb seems to be exclude any fields you don’t need. There is a limit and some of the reports can hit that limit pretty quickly. When the limit is reached, the report no longer runs. At that point you have to go in and exclude some fields to get it working again. The tricky part is that you have to include any field that is included in the report, used in an expression in the report, or used to join tables together.
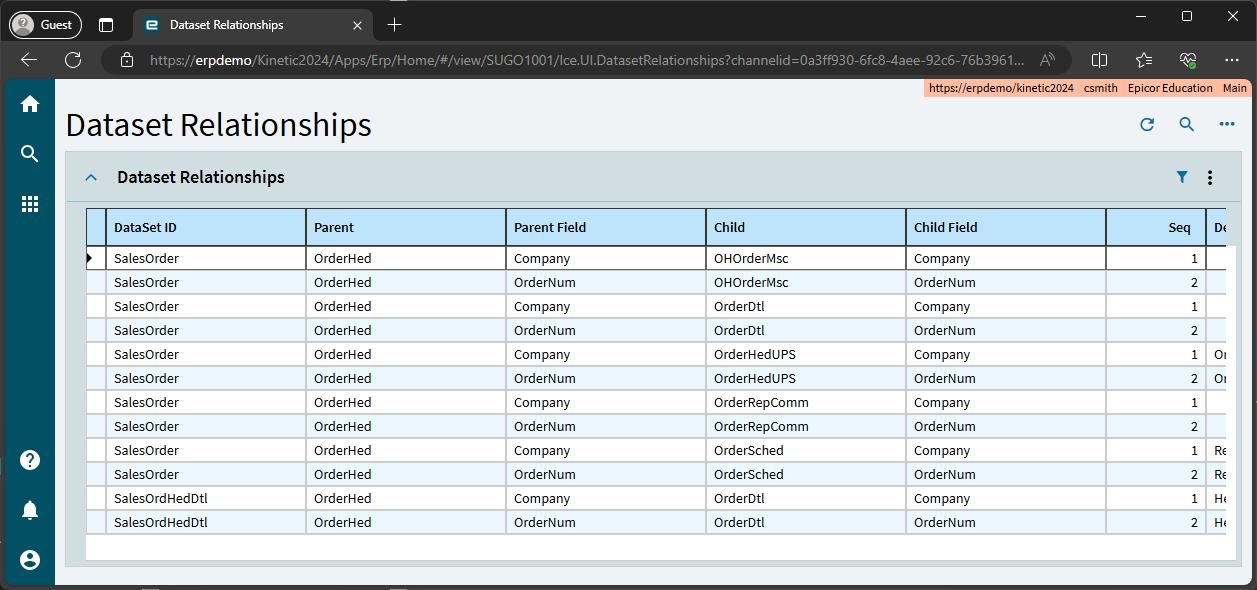
There is a tool included in Epicor called Dataset Relationships that will tell you how to link many tables together. You’ll have to tweak the columns a bit to make it actually useful because out of the box, it’s kinda broken. Make sure you have the Parent Table, Parent Field, Child Table, Child Field columns at a minimum.
For example, here’s the search for OrderHed as a parent table. This shows how to link OrderHed to other Order tables. It’s doesn’t show you every possible join, but it’s a good start. Plus once you know how it links to one table, you can often figure out how it links to another.
I believe the first thing that needs to be understood is what the RDD is doing. Let’s use the Order Acknowledgement as an example as it only has 10 tables.
When a report is run, it calls the RDD and the RDD is what is creating the tables in the SSRSReports database. The report instance gets assigned a GUID to identify it and all of the tables generated by the RDD are appended with the GUID at the end of the table name. Let’s say the GUID is “X”, that would result in the following tables being created.
Back when I was learning the system, I would run the report and then query the database for each of those tables to see what was actually created, because not all of them are. Once I understood what tables were actually being created, I could review the RDD to see how it was doing that. One of the things I learned from this is that every table that gets created in the database does not have a relationship defined (that you can see). I have determined that Epicor does some of the relationships in the code that users cannot see without the SDK. So, right off the bat, the RDDs are doing something that you cannot track down.
With that understanding you can start reviewing the data that is being generated. I always liked to create my own joins of the tables being created to figure out how the RDL was working. I would create a query using the SSRSReports tables to get the data the way I was expecting it, and then see what the RDL was doing with it. A lot of the logic is in the RDL Query. Once you have the data the way you want in the SQL query, you can compare that to the RDL query to see how it is being built. Diving into the details really helps you understand what Epicor is doing.
It is a pain to do this, but if you really want to understand and see where the shortcomings of OOTB reports are, that is the only way to do it. Once you understand that the RDD is just creating tables in a database and that the RDL query is doing the joins of those tables created by the RDD, things start to click. I think that might be the biggest disconnect for people, that the RDD relationships have absolutely nothing to do with the RDL, all the RDD is doing is creating those tables.
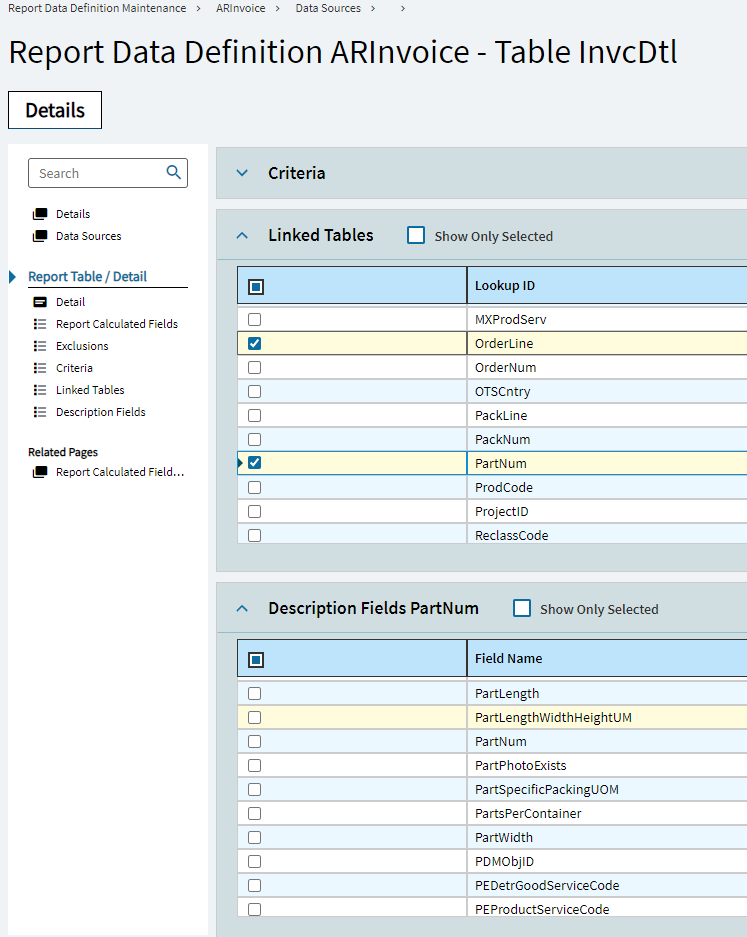
Relationships are one way, as described above. There is another quick lookup for fields that have “Like” fields in common already. You don’t need to add a relationship because Kinetic can make this link automatically for you. These are called Linked Tables. For example, say you want to show the PartWidth from the Part table on your invoice. You can look at the Linked Tables with InvcDtl, select Part Number as the key, then choose the field in the Description Panel. This field will now be included the data extract the next time you generate the report. I use these whenever I can because it’s easier than setting up a new relationship and men are bad at maintaining relationships.
The easiest way (for me) to understand the linking of tables is to create it in a test BAQ first. If you can get the data you want by joining tables in the BAQ… you would use those same joins in the RDD.
You need to be careful though, the join could always be there in the code that you can’t see. I did that once and was duplicating all of the records in the table that was output. That is why I advise seeing the SSRSReports tables before doing anything.
Another element of RDD based system reports is that some of the data is “calculated” in the report dll for that report. You won’t see how this is calculated only the placeholder for the data in the RDD. In some cases the name of the calculated version of the data is very similar to the database name, which can add to some confusion.
When “linking” tables via relationships, it’s also important to know that you cannot link the same table twice in the RDD. This can be limiting depending on the new report requirements. There are creative ways to get around this depending on your version and hosting architecture.
Also, if the column is used as a reference / link then it must not be excluded.
This seems pretty promising, ive been trying out some of the solutions people have in between my other regular IT duties I take care of, but I cant seem to get the linked data table field to work. Every time I pull this module up its simply blank. I am getting the same thing for the Dataset Relationships module in another suggestion. Wondering if my company using kinetic cloud is causing these fields to not function? If anyone knows why let me know, thanks!
Unfortunately, I have cloud so I am not sure if I can run a query before designing the data definition in epicor. Any tips as to how I can use your method with that in mind? Or alternatively is there a way for me to access my sql database despite the system being epicor kinetic cloud?
So this module when I try to open it in the new view, errors out, it is saying the application Ice.UIDbd.DatasetRelationships in not accessible. Not sure why thats happening but it seems to be crashing. Regardless, using the old view seems to work fine, but that being said what is the DataSet ID? It seems to be some sort of identifier for the dashboard that is being referenced but I cant seem to find it anywhere else.
That sounds like you don’t have access to it. It may be set to Security Manager Only out of the box.
Edit: Just checked in 2024.1 and it’s not Security Manager Only by default. It is under the System Management menu however and that’s often something locked down understandably.
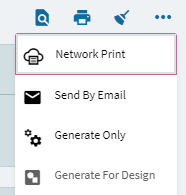
It would be on any base report in the system. Try it on the Sales Order Backlog or Scheduled Shipments report. When the report dialog opens, select any of the parameters you want and then go to the overflow menu. Select Generate For Design. If it is grayed out, it is because you need access to it. The help for this functionality was ok in 10, have not looked at it in Kinetic yet.
There’s always a way. I’m surprised nobody else has figured out what those calculated tables are yet.
I’ve used resharper dotPeek and have been able to get to the source code of the .dll’s but haven’t found a way to get to their made up tables in the RDDs.
We need to figure this out!
Maybe we create an epicor idea to include those calculated tables in BAQ’s. That would definitely be helpful when trying to create something like stock status in a BAQ report. (If it doesn’t exist)
He is talking about running a baq to compare the results. You can do that on prem or in the cloud. I have customers on both and you can get data the same way.