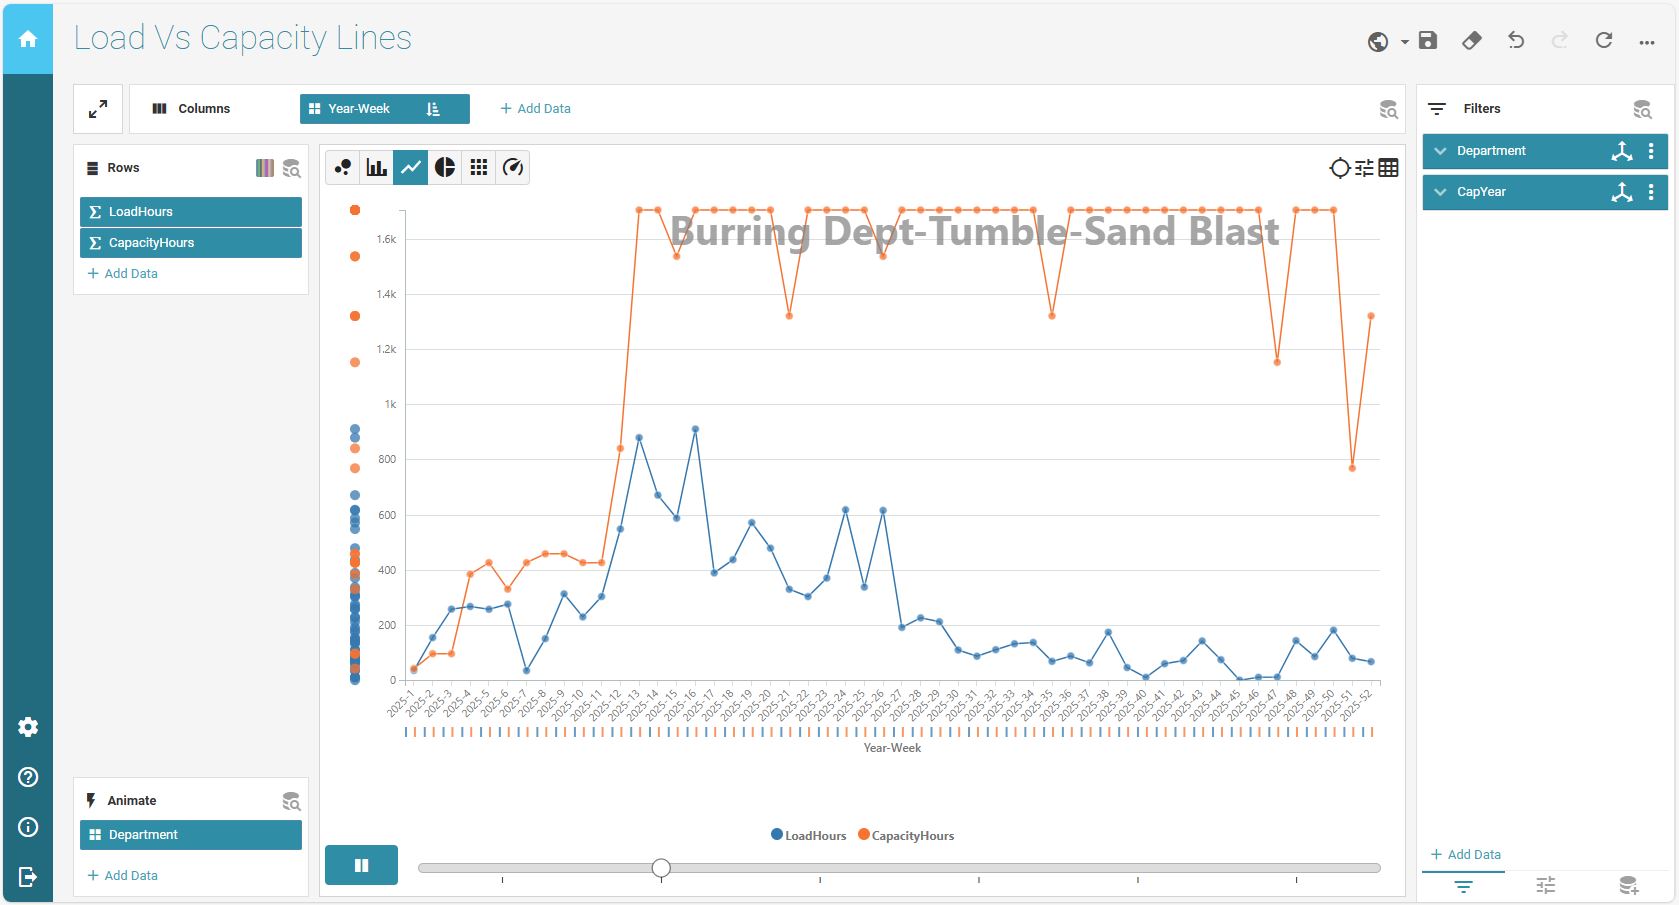
I have a great little BAQ that pulls the capacity and load for select departments resource groups. I am visualizing this in Data Discovery (I can’t believe it either!) This looks pretty good. Animated on a few departments so we can see it step through the load over capacity.
As many others before me, we only have our machines as resources. We do have generic labor resources in each op, but we don’t judge them by capacity. How can we move towards changing that? In the end I would like another line on this graph to show the human capacity along with machine capacity. I am not sure exactly how I would do that.
Infinite scheduling. We do not run global scheduling or calculate global scheduling order. We do not run MRP. Ideally, we forward schedule only. Attached my BAQ for reference. LoadVsCapacity.baq (50.5 KB)
Looking closer at the ShopCap table, I dont see any differentiation between the machines and the labor.
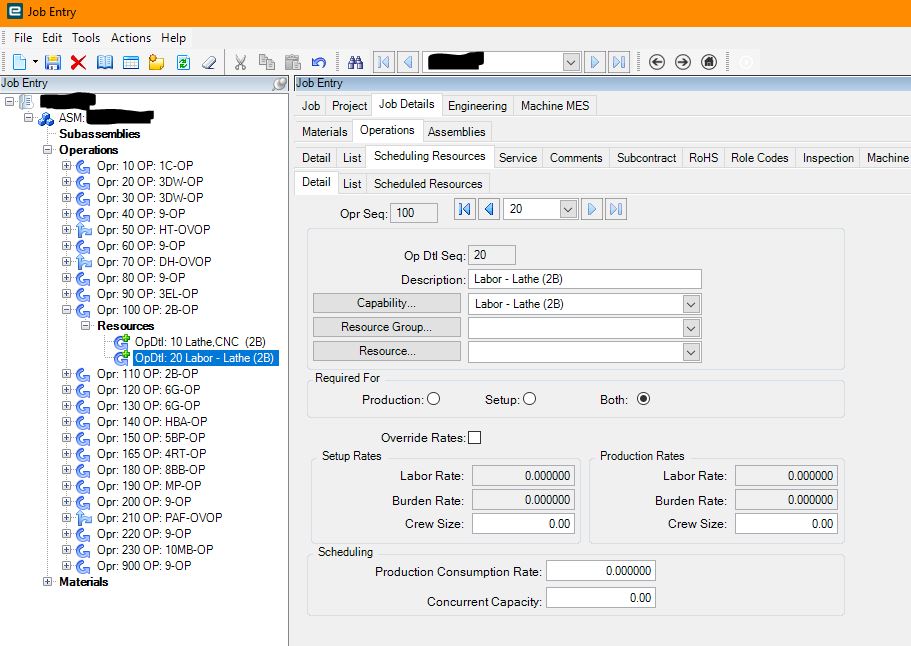
Since we use capabilities, setup with a machine resource and a labor resource, perhaps I need to look at the CapResLnk table, but I am not sure how or where to link it.
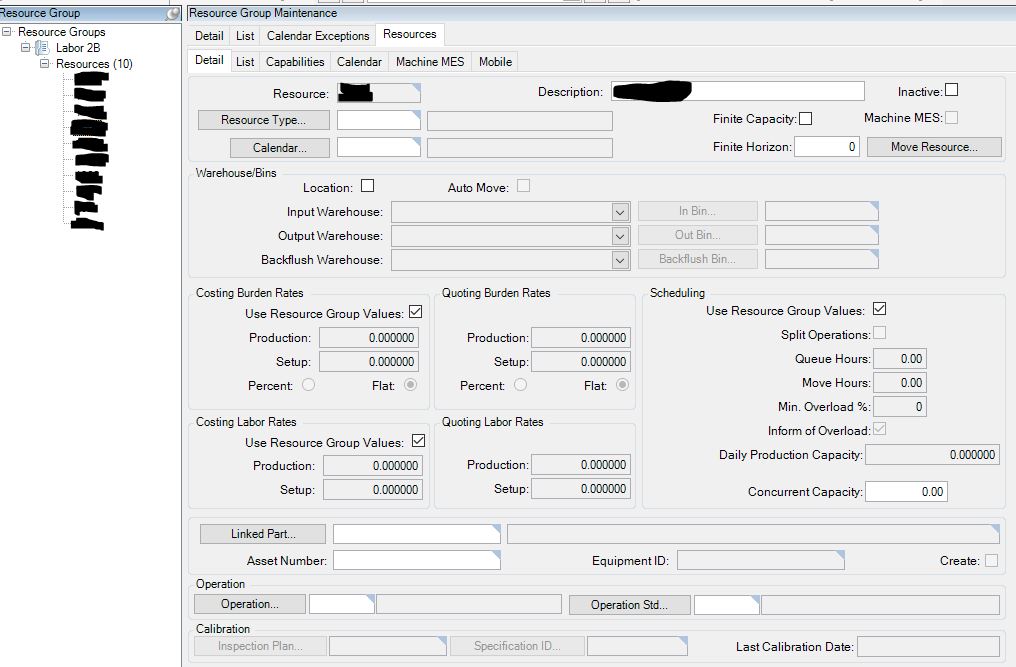
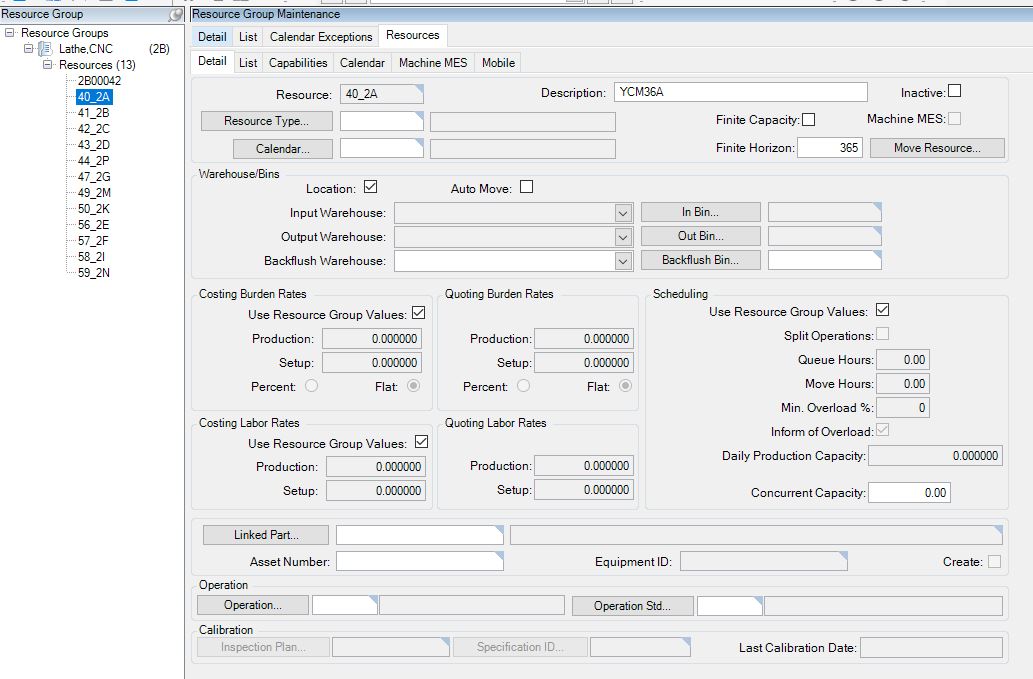
Do you have resource types identified? If you have people versus machine types you could use that to differentiate. There is also a track productivity box in resource group. When I was building reporting, we had things like queue times, packing setup not to track productivity so I could easily exclude them. Our queue resource groups were at $0 cost, just a placeholder so we could put padding for long lead times in our job schedule.
Yes! I used “L” as the prefix for any labor resource groups. Great point! I was able to filter on this in the shop cap table and get exactly what I needed. Now if we could just use Epicor more effectively then this data would actually be useful!