It Probably Matters if you are on-prem or loud. My first goto would be to recycle the application pool (after you checked your Epicor Server to verify it’s working properly) then, I would probably run Conversion 191 in the Conversion Workbench - Also, if it’s a specific user have them logout and log back into Epicor after the cache clear.
If it’s s specific user, simply have them completely clear out their cache in the browser - but yes, by all means, @Banderson is correct - read through that thread in its entirety.
Ohhh… let me add since the released update to 2024(11).2.x - This is something NEW for us related to the issue with the dashboard mess… we have had users that have saved their layouts with various sort options that just spin… clear the saved layouts for the user…
There is NEW BUG also introduced (I just became aware of it yesterday). Whereas if you are making any type of PIVOT TABLE by dragging a column to sort, it completely breaks the dashboard. I’m documenting that today.
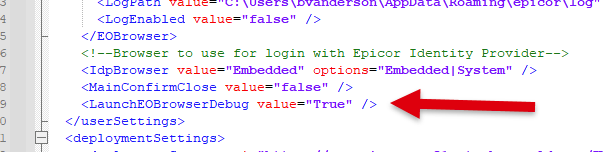
I added this to my config file to try and catch it when it was happening before, and interestingly, I don’t get it anymore, so I haven’t been able to catch it. Can one of you having the problem add that into your config file so you can see the network calls and see what’s failing?
I submitted a ticket with EpiCare to see what needs to be done. I had to submit a ticket with them yesterday because our Dashboards wouldn’t work. Just love when they update the system.
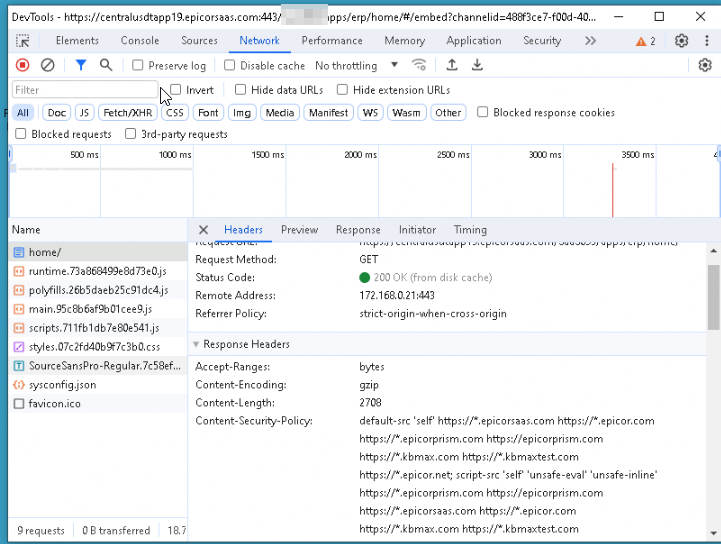
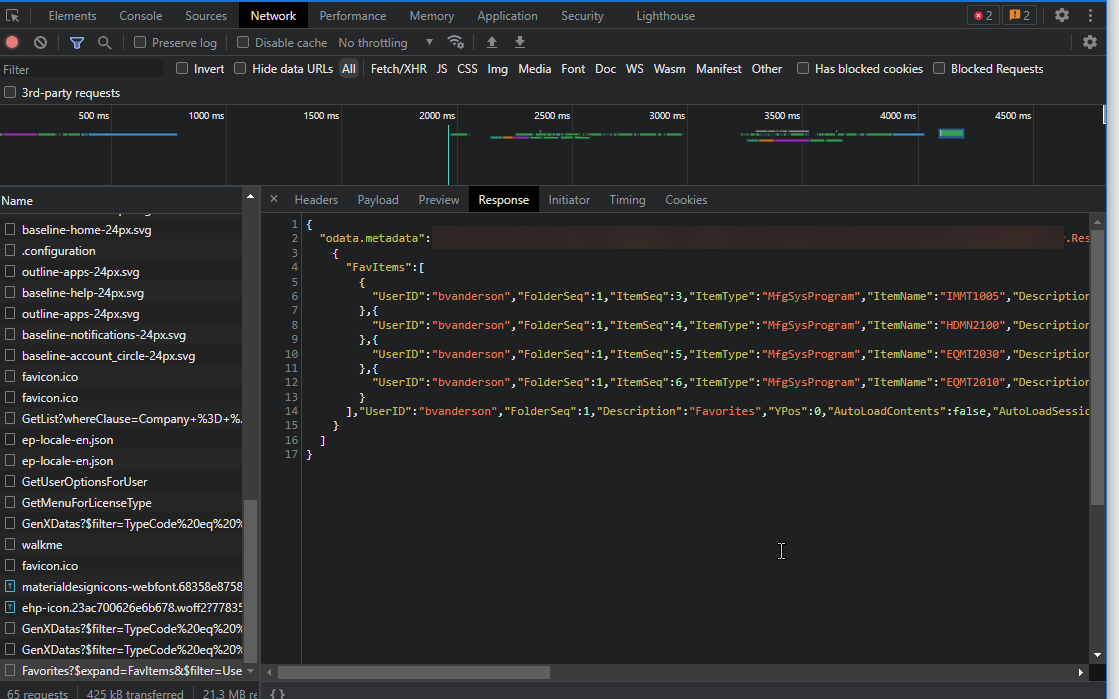
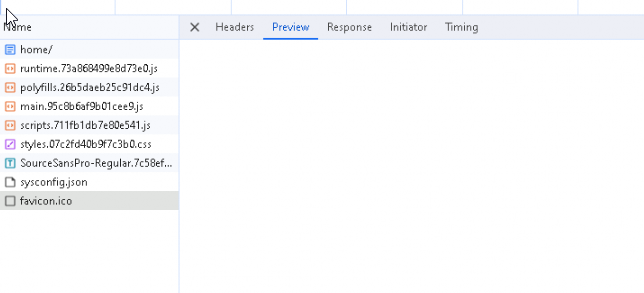
Start looking through calls, and look at the responses, and see if anything isn’t coming back, or coming back with errors. Is the last call that Favicon.ico? Are you on the white screen now?