Very new user here with a question about graphs in Kinetic view. I have a classic dashboard that has a section with bar graphs. When converting to Kinetic view I lose the graphs. Is there a way to create bar graphs within Kinetic/App studio? Or even better, how do I ensure the classic dashboard graph is generated when deploying a Kinetic view?
@hmwillett @dgreenEA
As far as I know, they don’t have support for graphs in dashboards in the new UI yet.
It’s possible that once they convert the dashboard editor screen over to App Studio that they’ll add that in, but for now, you’re out of luck.
1 Like
That is a bummer… Thank you for your response!
1 Like
I am really glad you asked this today as I was about to have my heart set on this very idea.
I really am befuddled by that.
I know 0.00000000001 of what there is to know about Data Discovery, but that has gauges and pie charts right?
It does, but it’s more for your homepage, if I recall. Not so much dashboards.
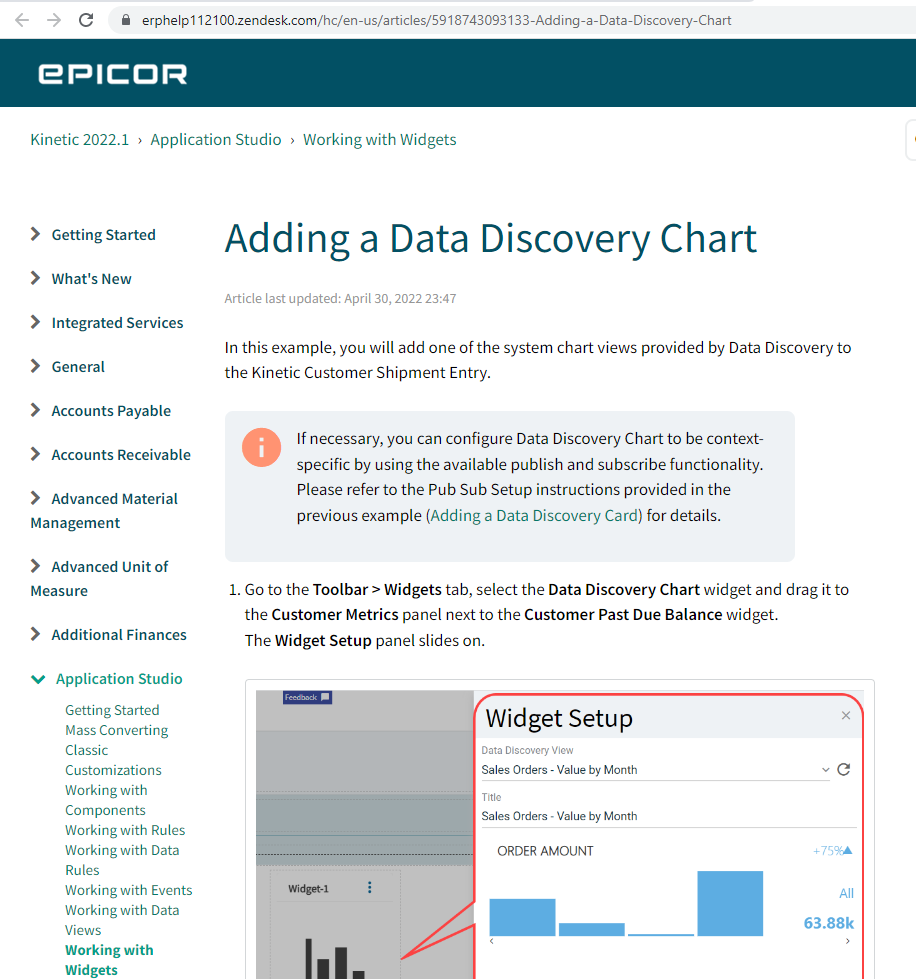
I thought I saw there was a way to add a Data Discovery Card into an App. Just not a layer on a Dashboard then?
When in App Studio the only widget that is available to me is “Website Widget”. I have a ticket out to epiccare so hopefully I will be able to follow your advice.
Ha, it’s not advice. I am just beginning to explore this myself. But I sure hope I just happen to be right anyway.
In Company Configuration, make sure you have one of the Epicor Data Discovery packages listed and enabled. If not, Epicor will issue a new license and the cloud team will install it.
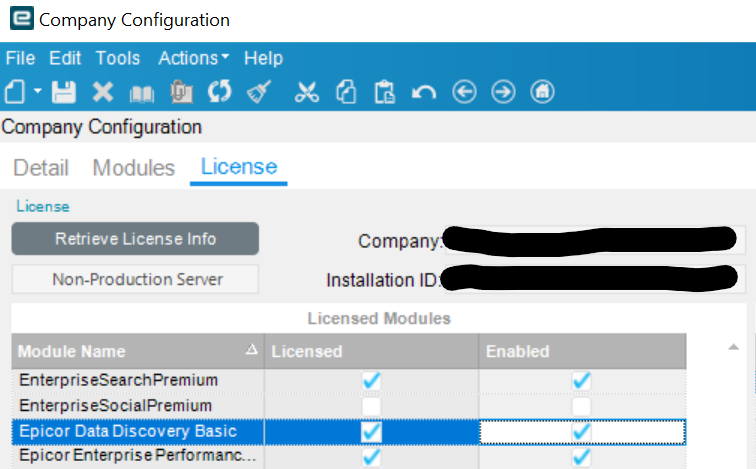
Looks like I have zero licenses. Thank you!
edit: Disregard, Boss man came over and confirmed that we do have these licenses and that they are in fact enabled. So I’ll be off to lick my wounds and wait on Epiccare to fix it.
1 Like
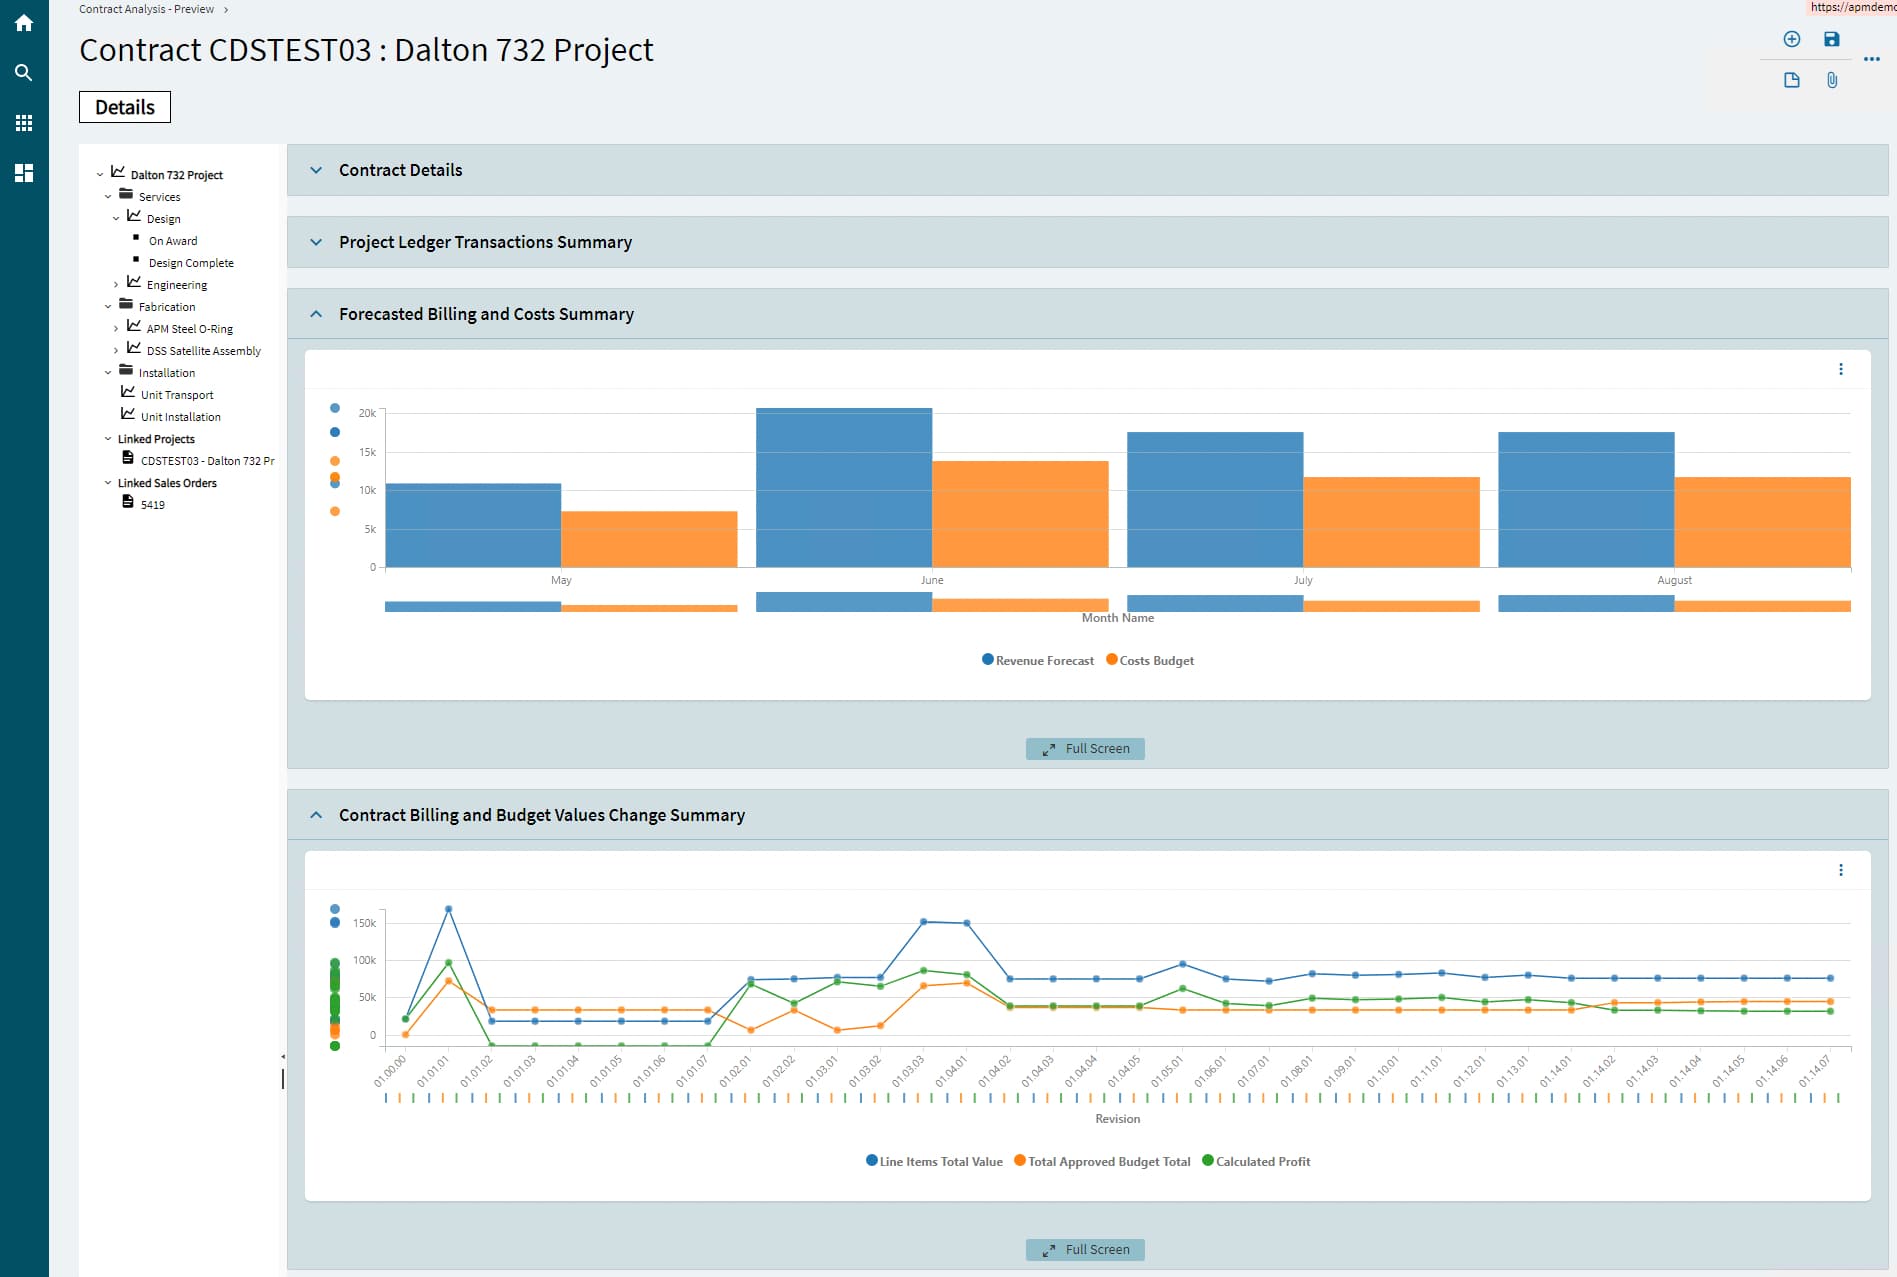
Earlier the integration of EDD graphs into forms and dashboards was quite limited and had some issues but as of recent I haven’t encountered any issues. There’s pros and cons compared to the old WinForm dashboard graph controls but overall I’ve preferred the new EDD graphs.
An example of some graphs integrated into a form
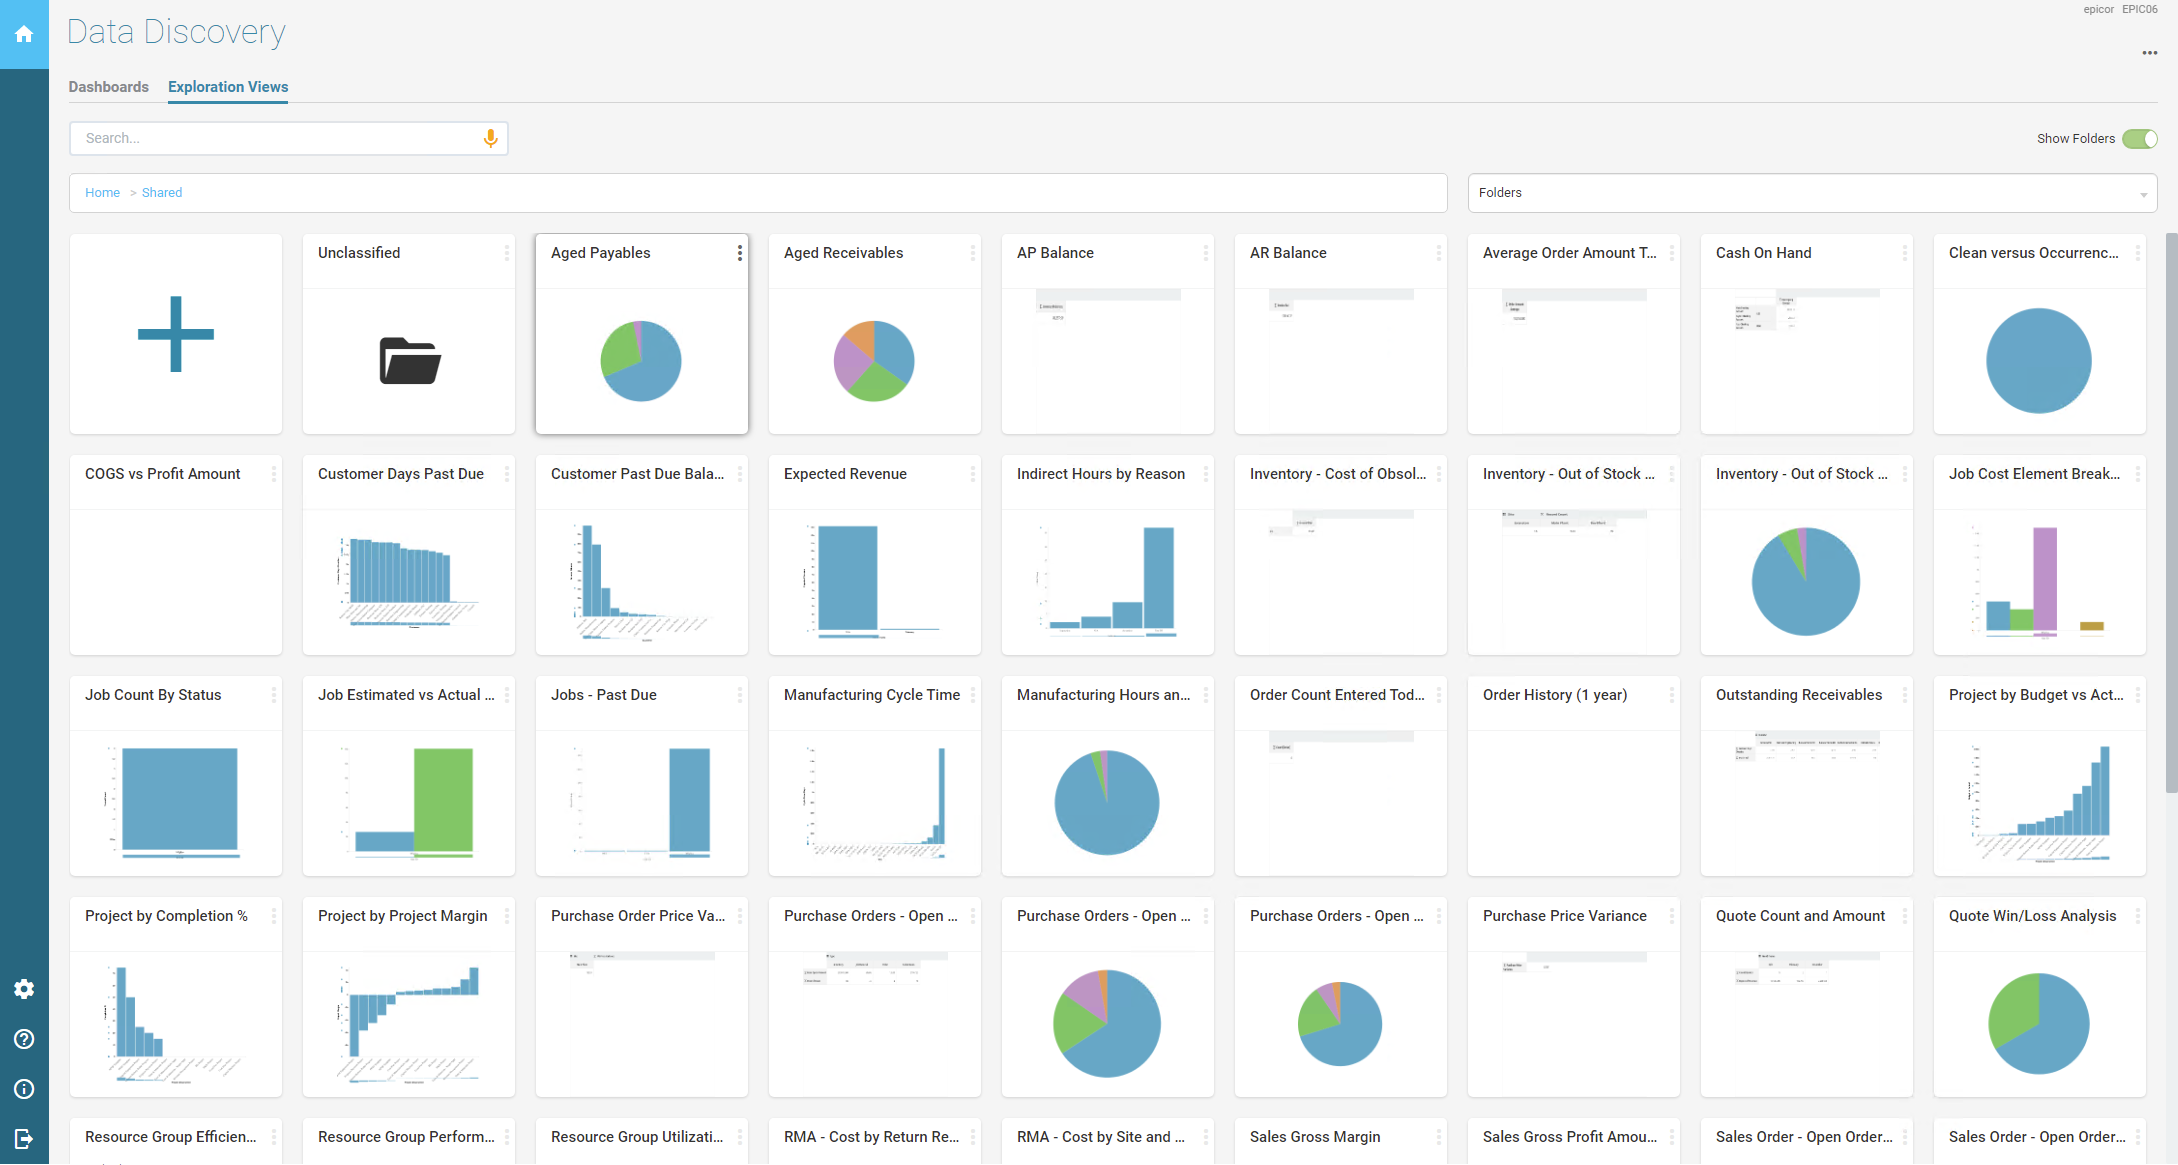
Some of the sample EDD graphs included - good for initial learning/review
2 Likes