A dashboard I made works differently when running the -Runtime (non-deployed version), than it does when deployed (or even just while testing during the Deployment process).
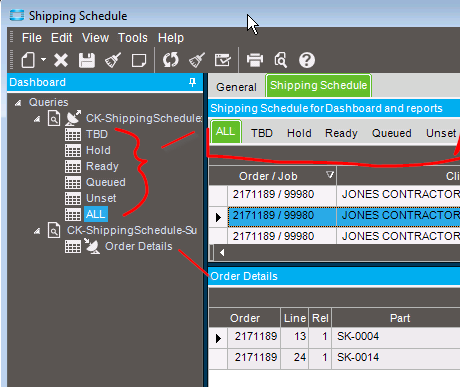
Here’s the underlying structure:
While in development mode, changing the tab on the upper pane, typically selects a different row from the upper panes Query results, and automatically updates the lower pane with the related line items.
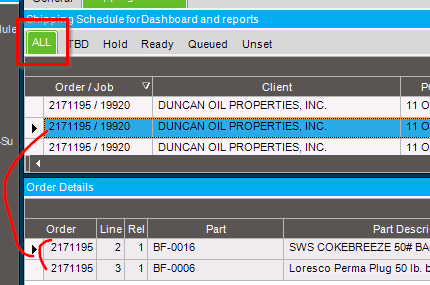
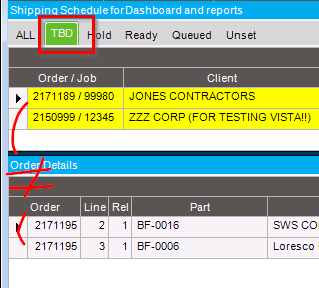
Here is the dashboard in devel mode. Notice that the upper pane has tab “ALL” selected, and Order 2171195 is selected.
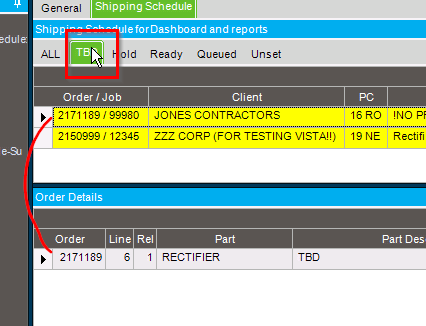
Doing nothing more than clicking on tab “TBD”, switches the selected row of the upper BAQ, and the lower pane automatically updates. The upper row switch happened because the previously selected row (when viewing the ALL tab) is not in the “TBD” tab.
But when deployed (or even testing during the deployment process), selecting a different upper tab, doesn’t seem to change the row selected on the upper BAQ.
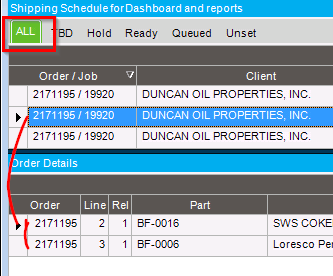
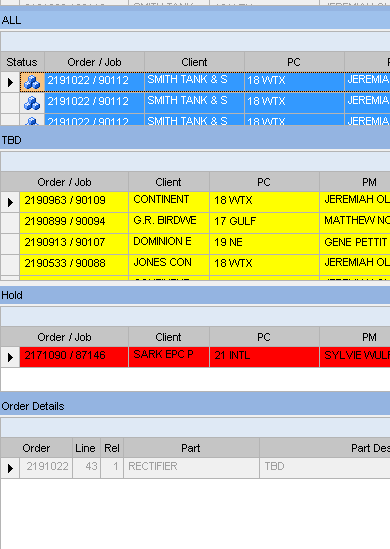
Here it is on the ALL tab with a record that is not in the TBD tab:
Just clicking the TBD tab, selects the first row on that tab (because the previous selected row from the ALL tab doesn’t exist on this one). But the lower pane still shows the details from the previously selected tab. Only by selecting the already select row in the upper pane, will the lower pane then update.
Just a hint that we’ve learned. Every time you make a change to te deployed DB and redeploy it, the client cache must be cleared so it will download the newly created DLL for the dashboard. Try that, hope it helps.
Yes, clearing the cache will help. I would also restart Epicor everytime I deployed as sometimes it gave me exception when I launch the new dashboard.
I find that the dashboard maintenance behave funny with labels, if you have a dashboard loaded and decided you want to modify another dashboard sometimes the labels will change by itself… It is quite random…
Thanks all. But this happens even during the Test Dashboard during a deployment. And since it doesnt appear to be working properly, I cancel the deploy.
I’ve had to delete the .dll out that deploying a DB creates to sometimes force it to use the new updated dll that I deployed. Remember that when you use a DB as a runtime it’s really opening up the DB application and then that loads the DB. When you are finished with your DB, you should always deploy it and then select ‘assembly’ in menu maintenance. Another idea is be sure in DB Maint you are saving the layout you set as the ‘default’ type before you re-deploy it. Hope some of this helps.
I have run into the exact same problem. None of the solutions mentioned addresses the problem. The dashboard works when in development mode, but the deployed assembly does not. I have verified the dashboard assembly is built and deployed properly. Epicor version 10.2.400.20 . Any suggestions?
I never found out why this happens. Just kind of accepted it as “nature of the beast”.
I may run a trace while in Dashboard developer (where it works as expected), and then on the Deployed Dashboard (where it doesn’t). To see if an easy customization my fix it.
In dashboard design mode with correct behavior the object called is:
Ice.Proxy.BO.DynamicQueryImpl
Execute
When tracing the deployed dashboard(unexpected behavior) the object is:
Ice.Proxy.BO.ReportMonitorImpl
GetRowsKeepIdleTimeWithBallonInfo
So in dashboard maintenance I can see the subscriber pane refreshes and executes the sub pane query. In the deployed dashboard, that does not occur. Does anyone know why that would be different? Is it a bug? Is it a setting? Something else?
That second one is unrelated to the dashboard. It is the System Monitor doing stuff in the background. I always exit the System Monitor before enabling tracing.
If I ignore that, it means the deployed version didn’t do anything, whereas in the dashboard maintenance mode, the Ice.Proxy.BO.DynamicQueryImpl, Execute is called. So my questions are still the same. Does anyone know why that would be different? Is it a bug? Is it a setting? Something else?
As you can see Order 2191022 is the one selected in the Details pane (the sub-query of the dashboard). This is because the row selected in the ALL section is for Order 2191022.
If the ‘ALL’, ‘TBD’ and ‘Hold’ sheets were still structured as different tabs, selecting another tab doesn’t change row of that tabs grid. So no event (to tell the subquery to refresh) happens.
If I select the ‘TBD’ pane (while ‘ALL’ has focus), the sub-query doesn’t update. Even if I click the already selected row on the ‘TBD’ pane’s grid. I have to select another row, on that grid, and then go back to the first row.
If I select a row on the `ALL’ pane (or tab), and that order doesn’t exist on the other panes, those other panes switche from the selected row, to the first row. But I don’t think they actually select that row, because its not the same as the other tab.