I’ve built a BAQ that uses several parameters as table criteria and used in windowed functions in calculated fields. When I run the query in the BAQ editor it runs within around 3,000ms. I’ve made a dashboard that just has a grid view with all fields from the BAQ. When I refresh the dashboard (either in the editor or in the test deployment view), it either doesn’t run or it takes more than 10x as long to load the data (depending on the date range).
What could cause the query to take so much longer to run as a dashboard than a
BAQ?
I’ll be interested to hear any comments on this because it’s something we’ve long noticed.
My rule of thumb is now to try to keep performance of BAQs as reported in the BAQ editor to half a second or less if users are calling on them frequently. But where they do need to be a lot heavier, you can at least ensure they run by setting a BAQ timeout setting in the Application Server. The default zero should mean unlimited, but in practice it doesn’t.
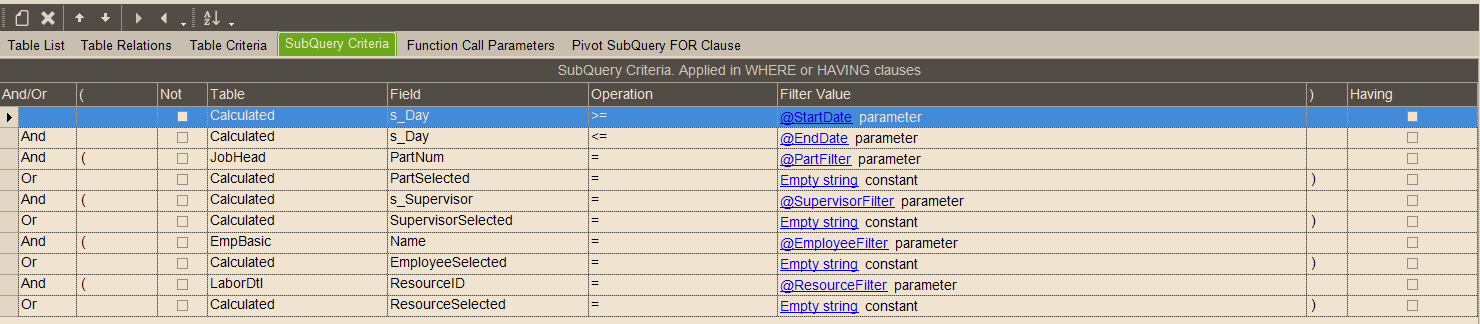
I’m trial testing to see what the issue is, I thought it was the 4 sorts I had within 4 window functions but there’s no difference in performance after commenting them out. so there’s something fundamental I’m missing here, maybe my parameters. I have 4 parameters that are baq linked, but those individual baqs are just a single table, like grabbing all part numbers, or grabbing all employee names, etc. Or maybe its this subquery criteria.
Thanks for the suggestions. I don’t have access to SSMS unfortunately, only the I.T. admin does. I just tried some settings in the execution plan and just confirmed that it is taking longer to run in the dashboard. If I increase the execution timeout then it will continue to process and show results, but it is much to slow. It is beyond the point of usefulness if it runs this slow. I must be missing something fundamental that causes the dashboard to process slower than the query editor.
100% now that it has to do with the subquery criteria. It Instantly showed results now, matching the ~3,000ms run time of the query editor. I’m not sure exactly why that is but that is definitely what is happening.
For your parameters - try using a UD Table and reference that table.
Make the UD Table updatable on the dashboard, in Key1 - put in the BAQ_ID
When placing the UDTable in the BAQ filter it for Key1 = BAQ_ID
I have started doing this on some dashboards that are run on a regular basis with the same dates.
I have also used the Orderhed table, created an order “100” and used the needby and Reqby date field to set a range
Brought it into the BAQ, filtered for the orderNum - it’s a bit of a hack, but gets the job done quickly.
I’m not sure if you were prepared for this or not but you’re officially hired to have my job. I don’t have the power to do so but it doesn’t matter. You’re hired.
It runs flawlessly now. Just added a case statement to set the field to _ if the parameter was empty, then changed the sub-query criteria from empty string to _. Instantly populated the dashboard.
Well, I guess I’ll be spending the rest of my day speeding up the past few years of BAQs then. And maybe leave your last comment as an inspirational quote on my monitor