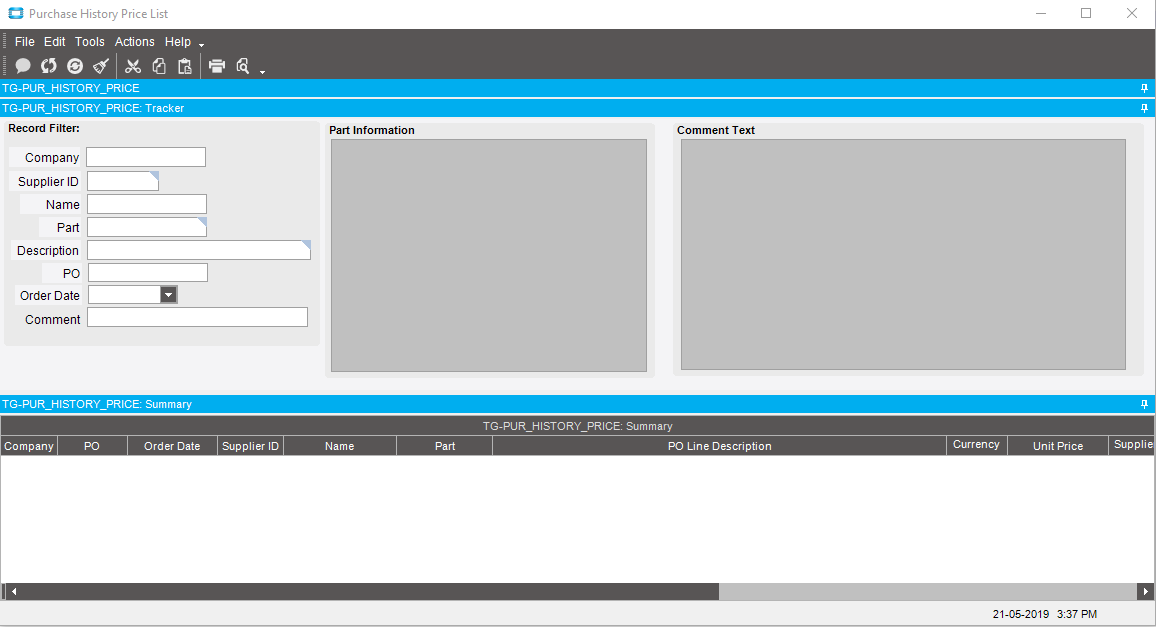
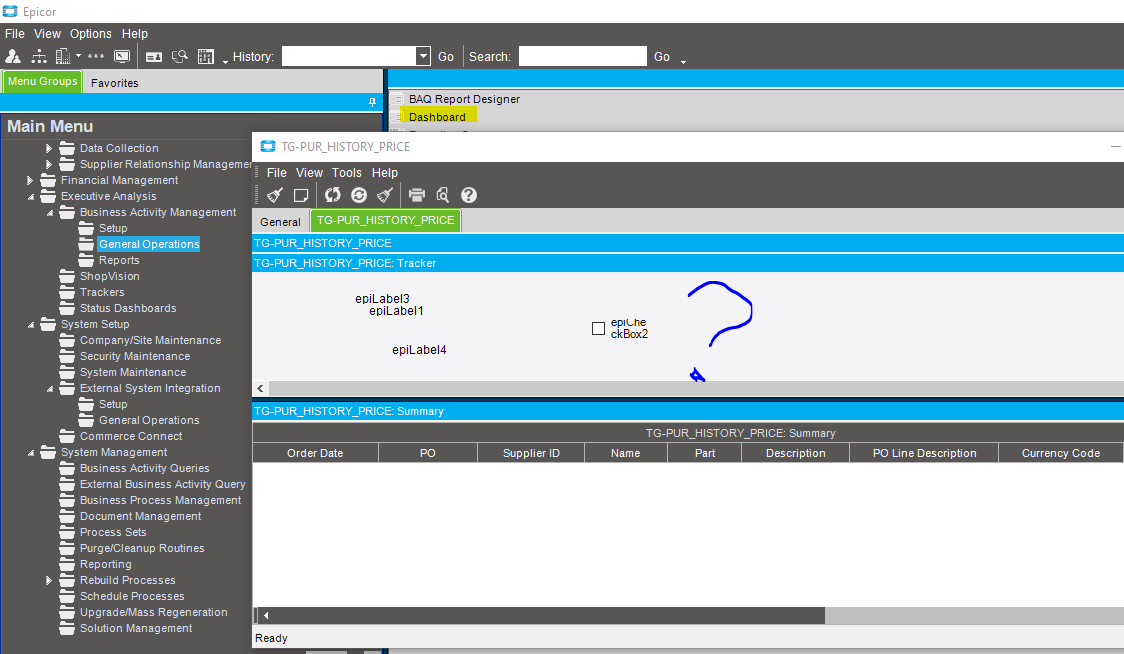
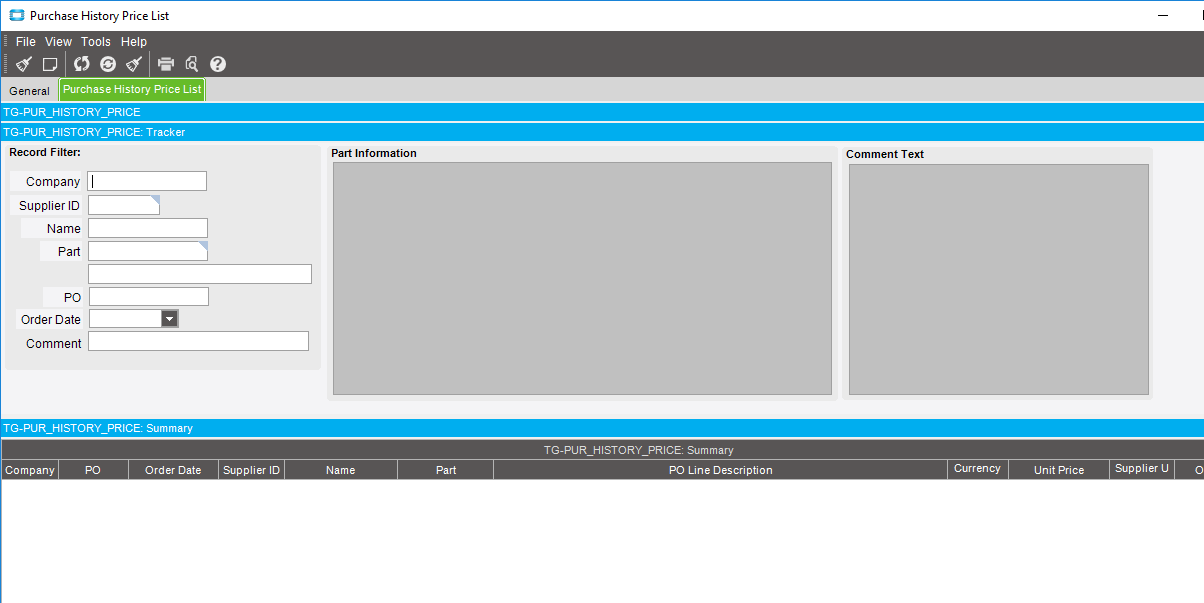
I am not 100% sure I understand exactly what your problem is. Are you trying to use the date time editors to create query results within a range? Is the problem that the box doesn’t work or that it is not visible?
To get the box to work, you will create a new date time editor in the customization window. Next, you will set the binding to OrderDate, change the dashboard condition to Less than or Equal To, set Dashboard Prompt to True, set IsTrackerQueryControl to True, and make sure that QueryColumn = {your order date column}.
Next you will right click specifically on the tracker view, select properties, and make sure that the fields you have in the view are actually selected as visible. You will also want to indicate that these fields are prompts and then double check that their conditions are correct. To set the dashboard such that these tracker fields can only be used as input values for filtering results, check “Input Prompts Only” at the bottom left of the editor.
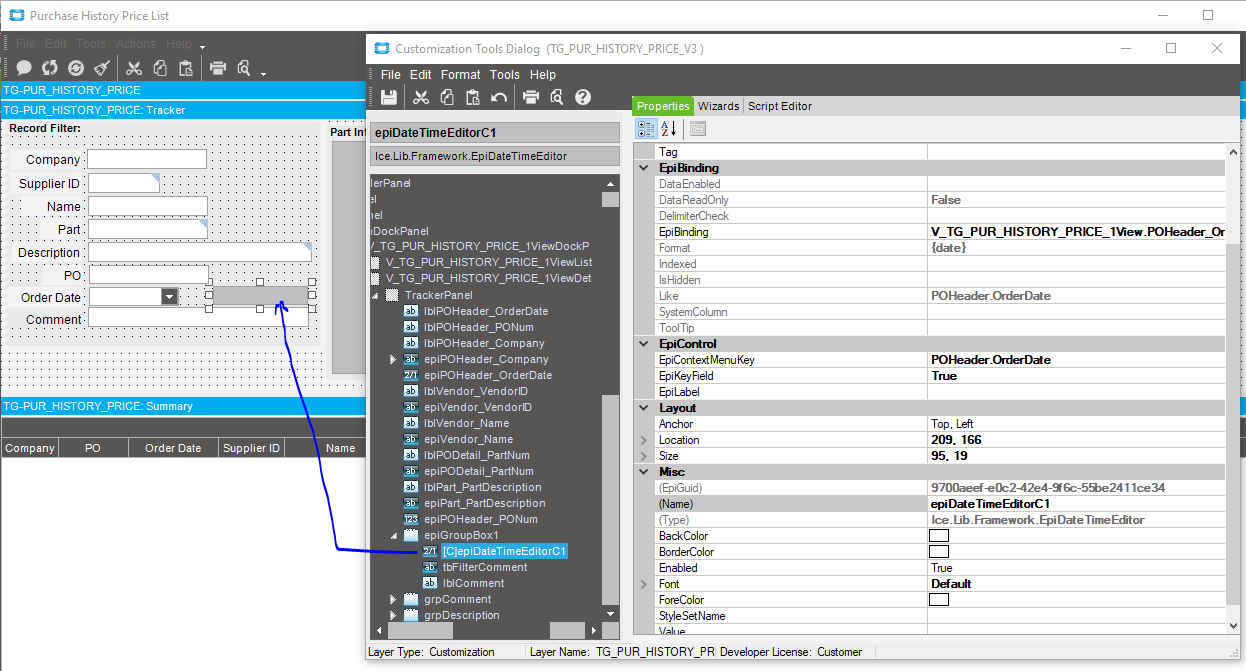
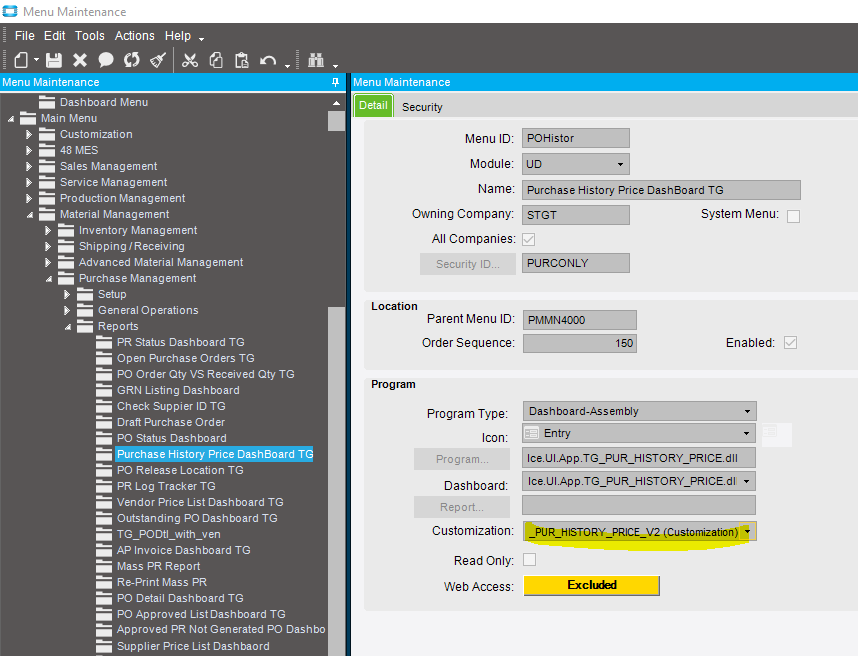
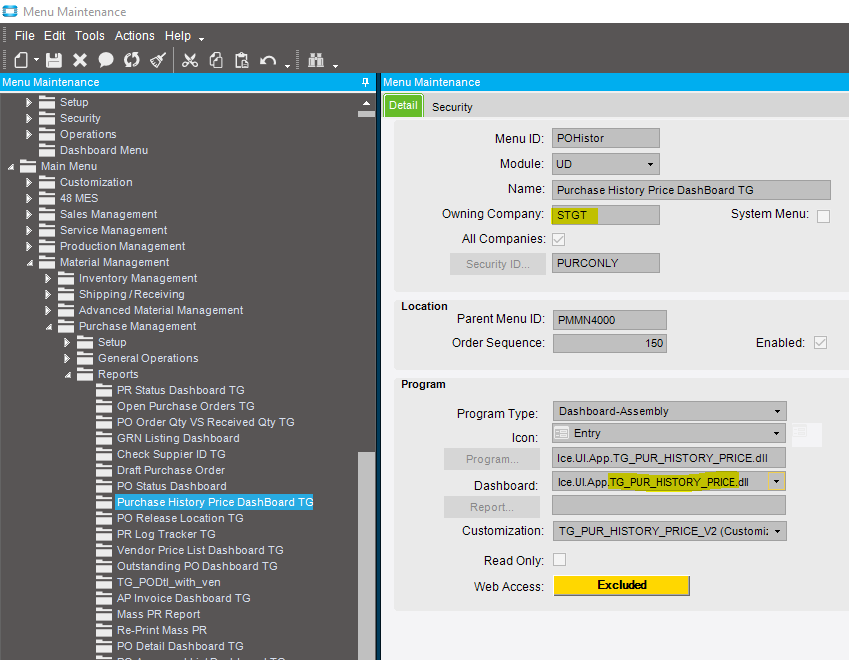
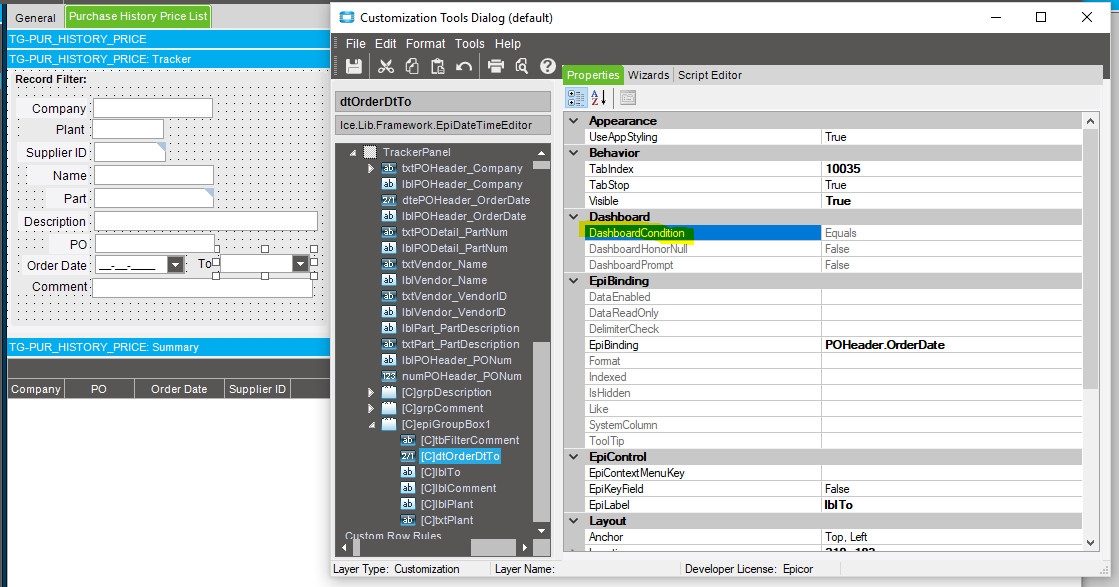
The problem you are having based on the pictures you added looks like an issue the customized version of the dashboard. look at the menu on menu security and please let me know if there is any customization added to the dashboard. If so that means that after the dashboard was created a customization was made for the dashboard. If that is the case and based on the design of the dashboard it looks like this dashboard was customized after deployment, you will have to open that customization in developer mode and in order to get that to date working first you will have to bind the field to the baq and the field then go to the code and add the condition less than or equal and then if after safe the field is still read only you will have to change the extended properties.
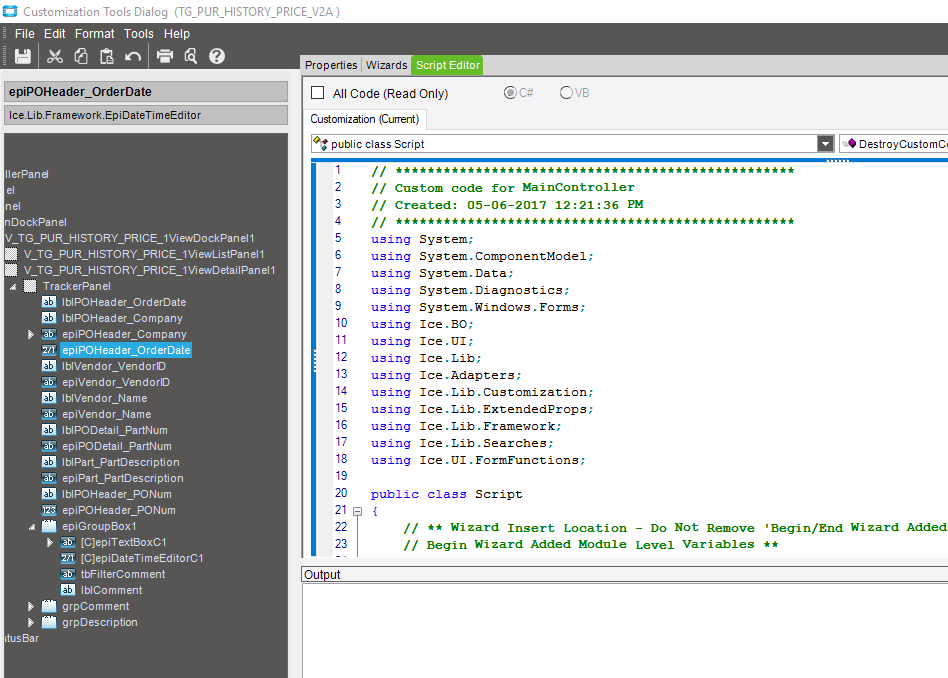
When I open the code in the Script Editor I couldnt find any code related to OrderDate. I’ve already bind the new DateTimeEditor to the BAQ and field but I’m not sure how to add it in the code.
Can you tell me when can I find the extended properties?
You dont want to add filters via the Customization… go to Dashboard Maintenance, open the appropriate Dashboard _V2 something then add it via Dashboard Maintenance. Atleast get to the Dashboard with a proper Tracker, then we can assist from there.
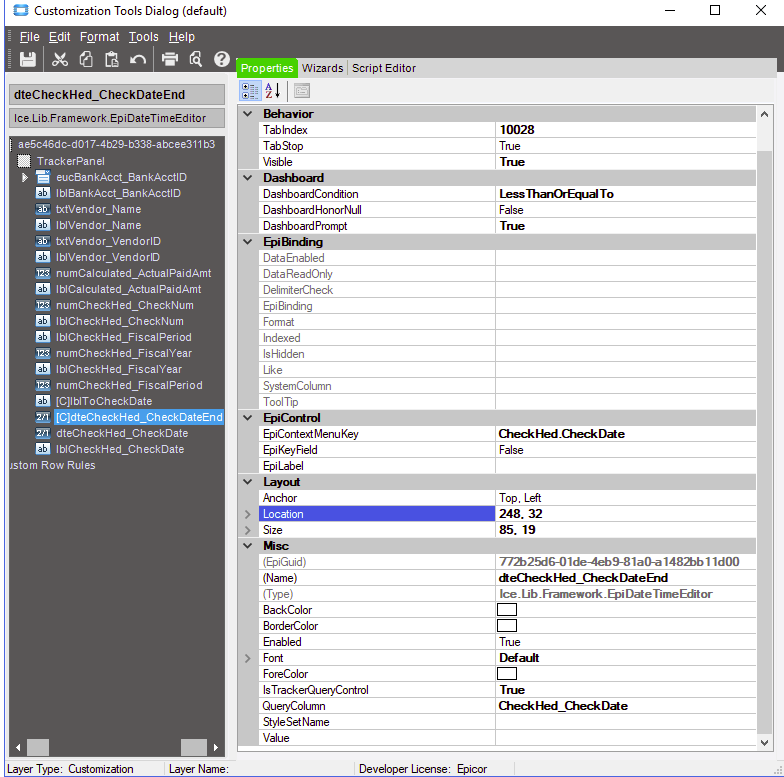
Typically you right click on the Tracker and you can then click Customize Tracker on the Dashboard, then you can add a 2nd date input field, bind it to the same field and change it to LessThanOrEqual.
Basically you will have already 1 Date Field OrderDate you change that to GreaterThanToOrEqual… but via Tracker Customization you will have to add a 2nd one and set its bindings to the same as the original one, only change it there to LessThanOrEqual… Example:
Notice: I named mine dteCheckHed_CheckDateEnd (simply adding the word End to it)
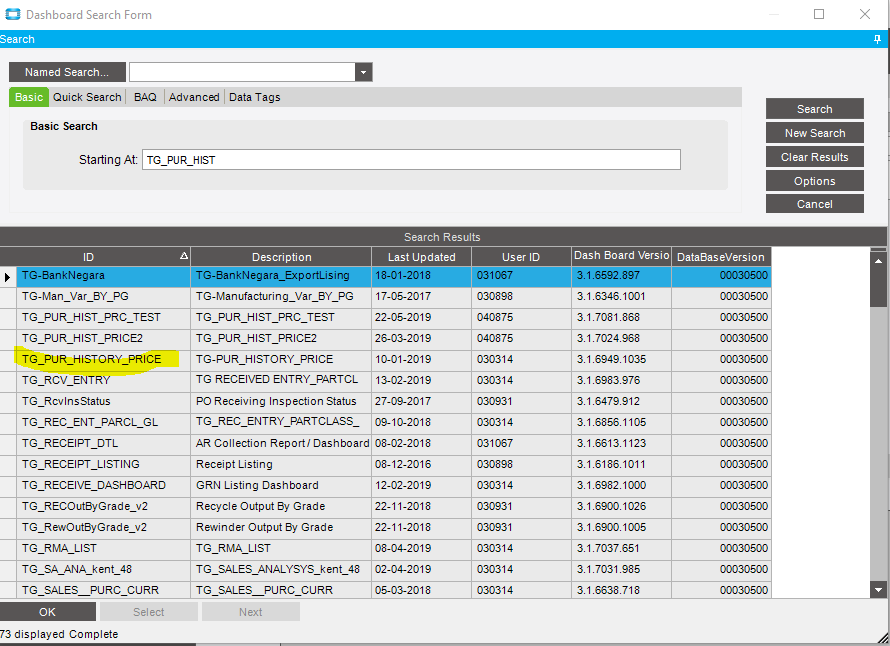
You sure there isnt another dashboard – same name, diff version or slightly diff description… search for dashboards look carefully
I have never seen that happen to an actual dashboard… I know those other elements were added via Dashboard Maintenance… because none of the filter fields have a [C] infront of them in your previous screenshots – so they definitely were not added via Customization on the Menu.
Are you Multi-Company? if so it may be in another Owning Company?
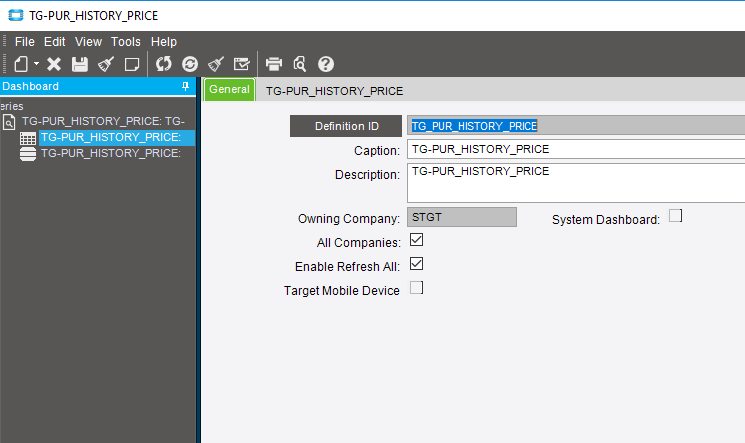
Yes we are Multi-Company and this particular dashboard belongs to STGT and I assumed the name of the dashboard is TG_PUR_HISTORY_PRICE and when I open the dashboard with that name it came out the way I showed you before.
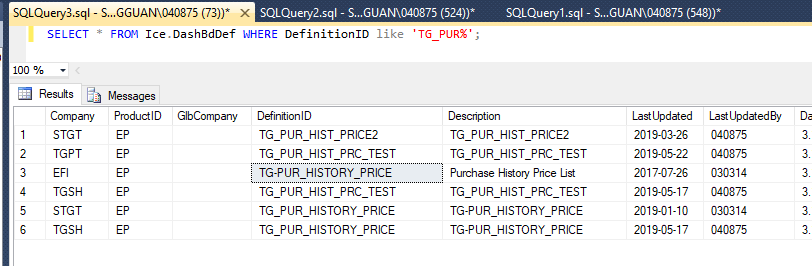
You can re-purpose the same Dashboard names in diff Companies, just because the Menu Maintenance or the All Companies flag is checked doesn’t mean there isnt another version in another company, it just means its available to run from any company… The easiest way is run a BAQ as Cross-Company or a SQL Statement:
SELECT * FROM Ice.DashBdDef;
I’ve been there where someone decided to make a Dbd in some other company instead of our normal Main Company and it was missed in upgrades and re-deployments etc.
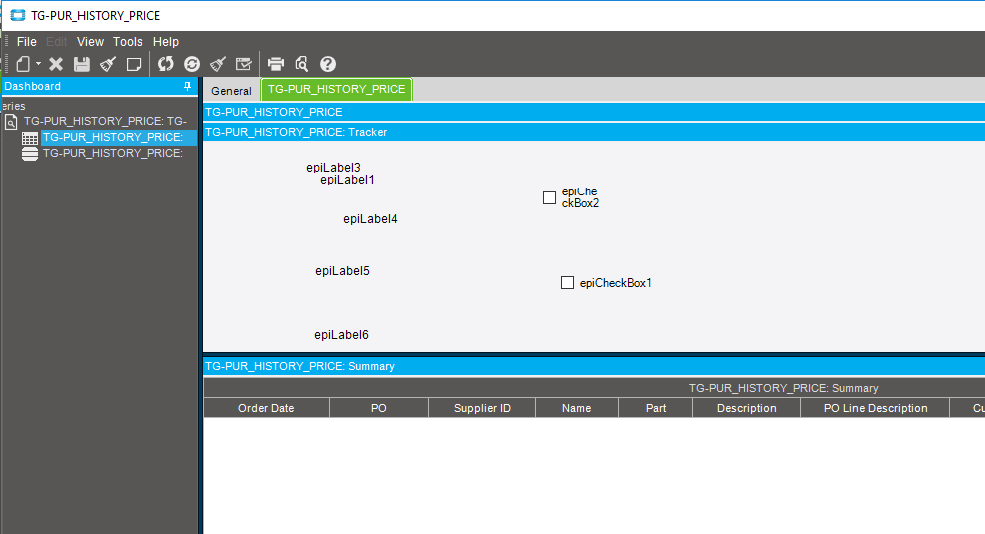
Maybe its: TG_PUR_HIST_PRICE2 in your screenshot – as stated, slightly differently named also the date is newer. Open up TG_PUR_HIST_PRICE2 see if it resembles your dashboard. The v1 may just have been a prototype that got ruined along the process when v2 came along and no one bothered to delete it.
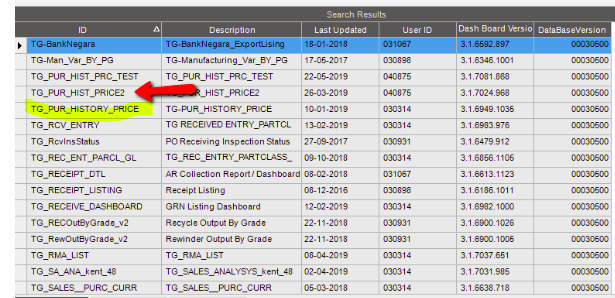
The 2 IDs above TG_PUR_HISTORY_PRICE are the ones that I copied from TG_PUR_HISTORY_PRICE and try to edit them but to no avail.
Here’s what I got when I ran your SQL statement. So there are other version of TG_PUR_HISTORY_PRICE exist in other company. Is that what this result telling me?
Yes it exists in EFI… Close all your windows switch companies to EFI and try Dashboard Maintenance there.
It is a very common problem when people mix customizations in Multi-Company… Rule of thumb is make all Customizations in your Main Company and mark as All Company… Basically, no one Customizes anything Company-Specific it all gets it from some Main Company whichever you decide to be your “Master Company” – same thing @MikeGross does too
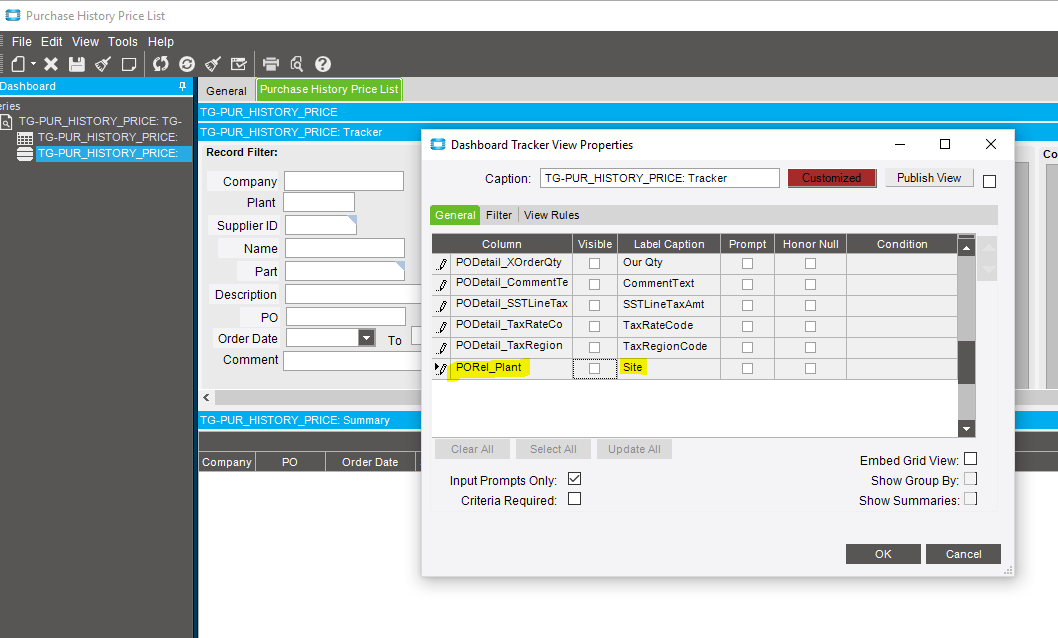
Hi, sorry to trouble you guys again. I’ve modified the BAQ for this dashboard by adding PORel_Plant in the display fields and when I tried to make PORel_Plant visible to use it as part of the tracker filter it is disabled.
So I decied to use the customization tools instead. I also added “Order Date To” fields as part of my client’s requirements and bind it to POHeader.OrderDate, I try to set the DashboardCondition to less than or equal. But it is disabled. Is there anything wrong with what I’m doing?
Set the IsTrackerQuery Control Property to true, then set the DashboardPrompt property to true.
Once you Customize the Tracker one time you can no longer add fields using the Wizard, only Tracker Customization Mode – you can always delete the Customization and start over.
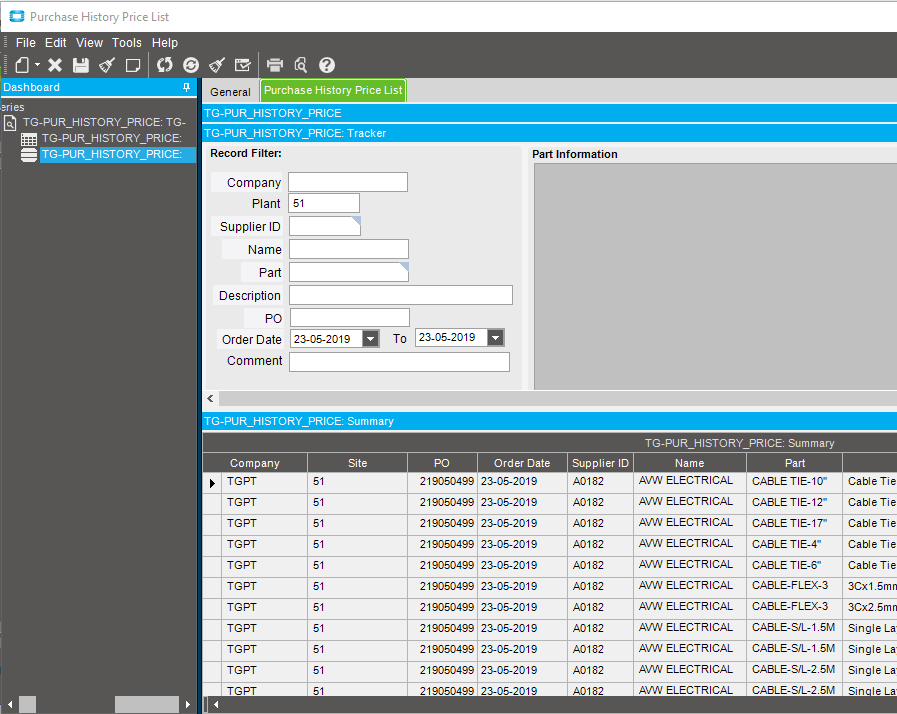
Thanks again Haso, you saved me again. The Plant & Order date is working now!
Now I’m facing one more problem. When I deploy the dashboard, I click on “Test Application” to test my dashboard but the newly added Plant & Order date is disabled. Any reason why?