Hey everyone, I am on 10.1.400.17. I keep seeing videos for adding charts and graphs to dashboards, but I do not have that option. I can add trackers and gauges, but not charts. We have the executive analysis module, is there another one that we need to do this? Thanks for the help!
It doesn’t show up when you right click on your query?
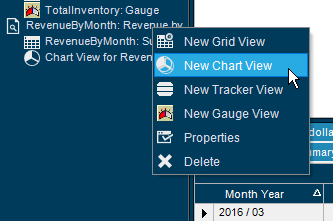
nope, I just have Grid view, tracker view, and gauge view
and even then, sometimes gauge view is there, and sometimes not. I have no idea how to have it always be an option…
Do you have a query loaded already? Some options may be greyed out until a query is loaded into the dashboard.
Figured out our issue. We did not purchase the correct module… gotta love Epicor!
1 Like