Better Kinetic Tracing

Many of you know (or should know) about the Trace Helper Utility, written by @josecgomez and @jgiese.wci, for parsing Smart Client trace files. For the Kinetic browser (not the EO Browser embedded in the Smart Client!), most of us use the Chrome Developer Tools EpiCare article about Kinetic Debugging - KB0125576 to follow a trace. It is not nearly as nice as the Trace Helper Utility, but it is powerful. With all the web-developers out there, is there something better for sharing information when debugging? There is. Enter Playwright.

Playwright

Playwright is an opensource, end-to-end testing program backed by Microsoft that has been gaining a lot of momentum, and for good reasons. It has many very useful features, including:

  • runs tests on Chromium, Firefox, and WebKit (Safari) browsers for various viewports.
  • has a screen recorder to make writing tests easier
  • can test APIs and can simulate specific results (mocking)
  • writes tests in JavaScript/TypeScript (Node), Java, Python, or .NET.
  • records video, network traffic, and does screen captures while testing

It is the last item that we will investigate further to see how this tool can help with debugging Kinetic Browser apps, and passing the trace along to others.

Installation

Installing PlayWright is as easy as adding a Nuget package and running a PowerShell script to install the test browsers.

Start by creating a Test project in a new folder:

dotnet new nunit -n KineticTrace
cd KineticTrace

Add the Playwright Nuget package:

dotnet add package Microsoft.Playwright.NUnit

Build the project:

dotnet build

Once done, the project contains PowerShell scripts to perform various tasks. First, we Install the Browsers:

pwsh bin/Debug/netX/playwright.ps1 install

Where netx is the version of .Net. For example if using DotNet 7, enter:

pwsh bin/Debug/net7.0/playwright.ps1 install

That’s it for installation. You will do this for each project.

Tracing A Session

Once we have a project, we can trace a session using Playwright’s CODEGEN utility.

pwsh bin/Debug/net7.0/playwright.ps1 codegen https://k20231.teampti.dev/kinetic2023_1/home

This opens an isolated browser at the URL specified in the command above. You will notice that while you are navigating Kinetic, parts of the screen are emphasized with colored boxes. These are the Locators that Playwright uses to find elements on the page for navigation and tests in scripts. When possible, PlayWright uses ARIA-Labels and Roles. There’s an Epicor Idea to allow us to create these to help our debugging. As long as we and Epicor maintain some unique addressing into the future, we should be OK. We won’t need ARIA labels for tracing, but they are extremely important when writing tests, which will be a different post.

The Playwright Inspector window will contain the C# (for JavaScript, Python) statements. For tracing, make the target a Library.

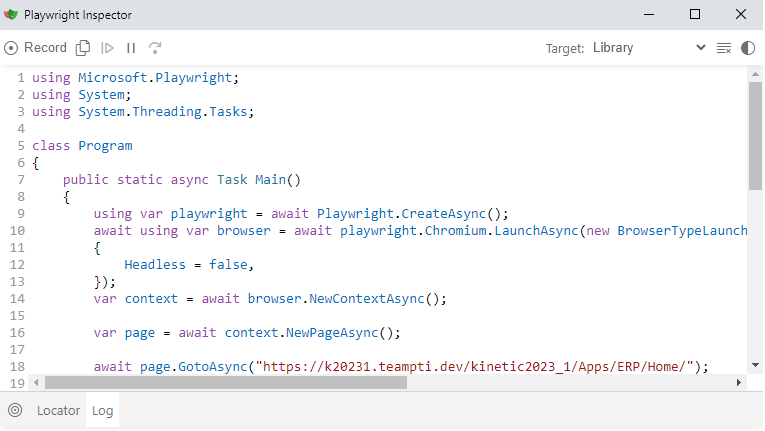
Click on the “Record” button to stop the recording.

With the code from the recorder, we can now copy it over the Program.cs file. To enable tracing, we will need to add some code to indicate what we want to trace and where to put the resulting trace file.

Add this code after we create the new browser context:

        var context = await browser.NewContextAsync();
        
        // After here
        await context.Tracing.StartAsync(new()
        {
            Screenshots = true,
            Snapshots = true,
            Sources = true
        });

        // Before here
        var page = await context.NewPageAsync();

At the end of the program, indicate where you want the trace file.

        await context.Tracing.StopAsync(new()
        {
            Path = @"C:\Users\Administrator\source\repos\testtrace\trace.zip"
        });

(Relative references did not work for me, but I may have messed something up.)

Save Program.cs then do a dotnet run to create your trace.

dotnet run

Trace Viewer

The Trace Viewer is a progressive web app that reads a trace file locally and allows the devloper to step through trace. It has all the goodness of the Developer Tools with a nice UI wrapped around it. Open a browser and go to this site:

https://trace.playwright.dev/

This is a Progressive Web App that runs in offline mode. Nothing is sent to Microsoft. Open your trace file created above.

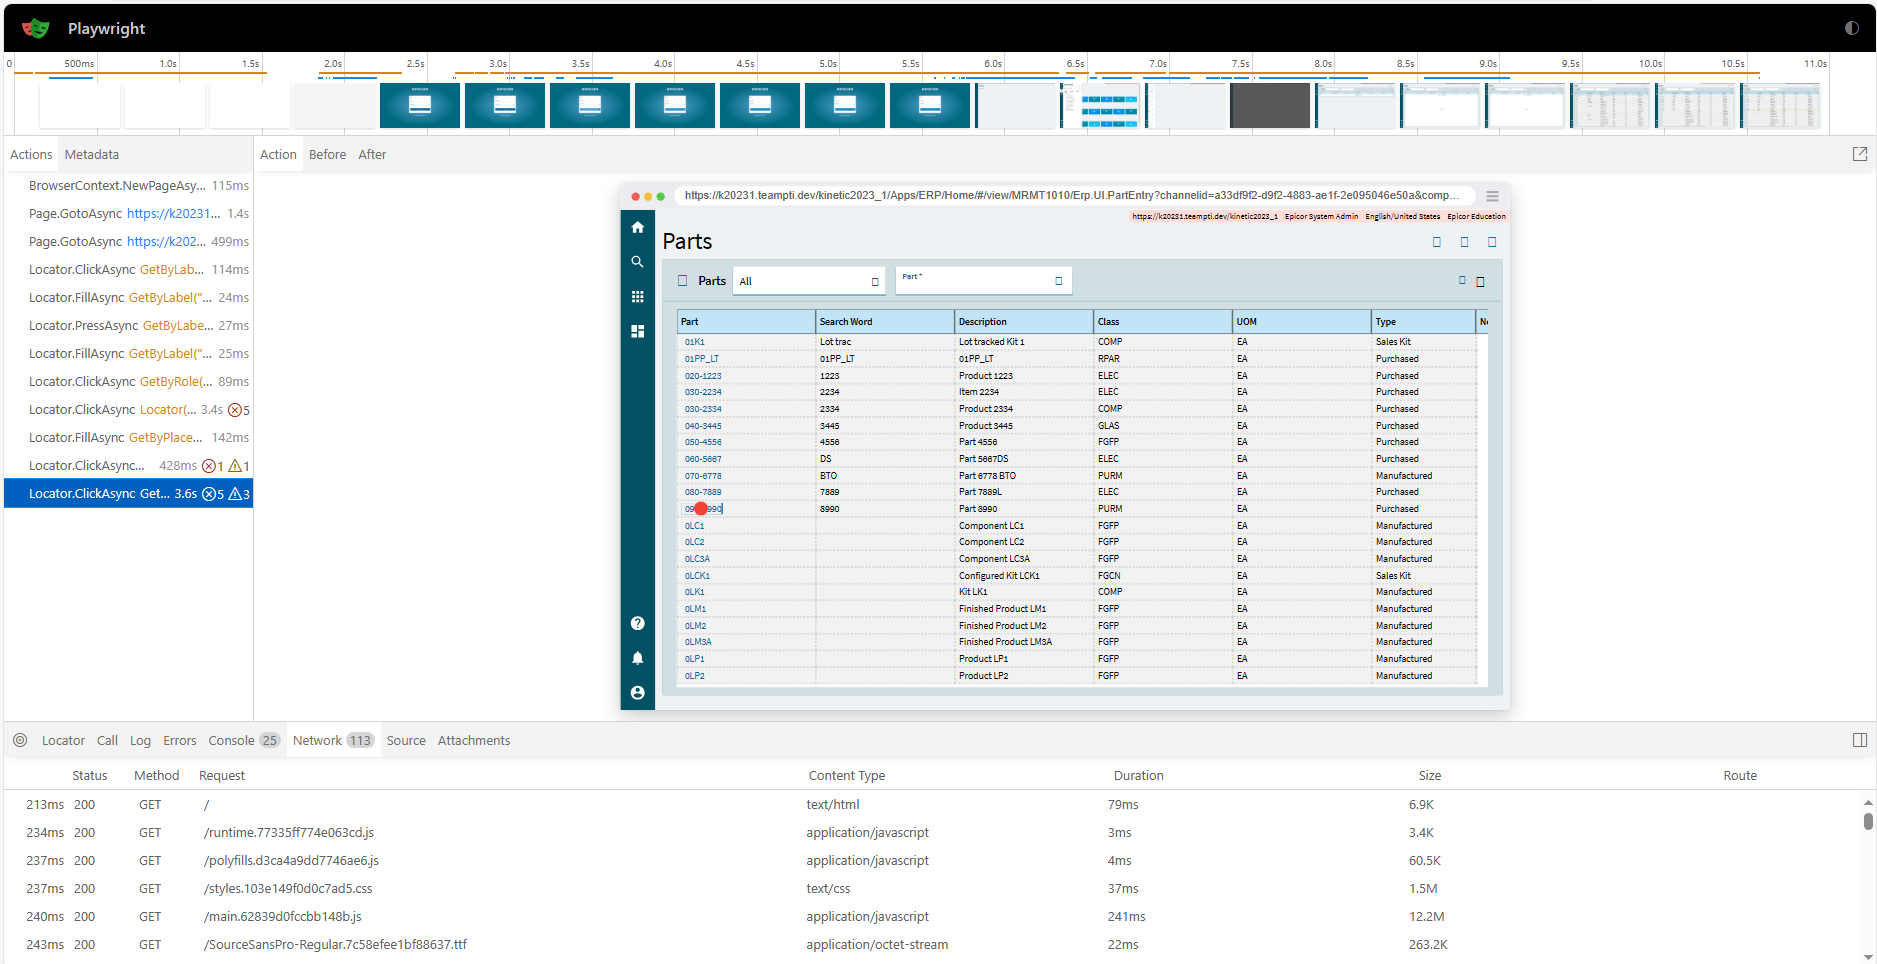
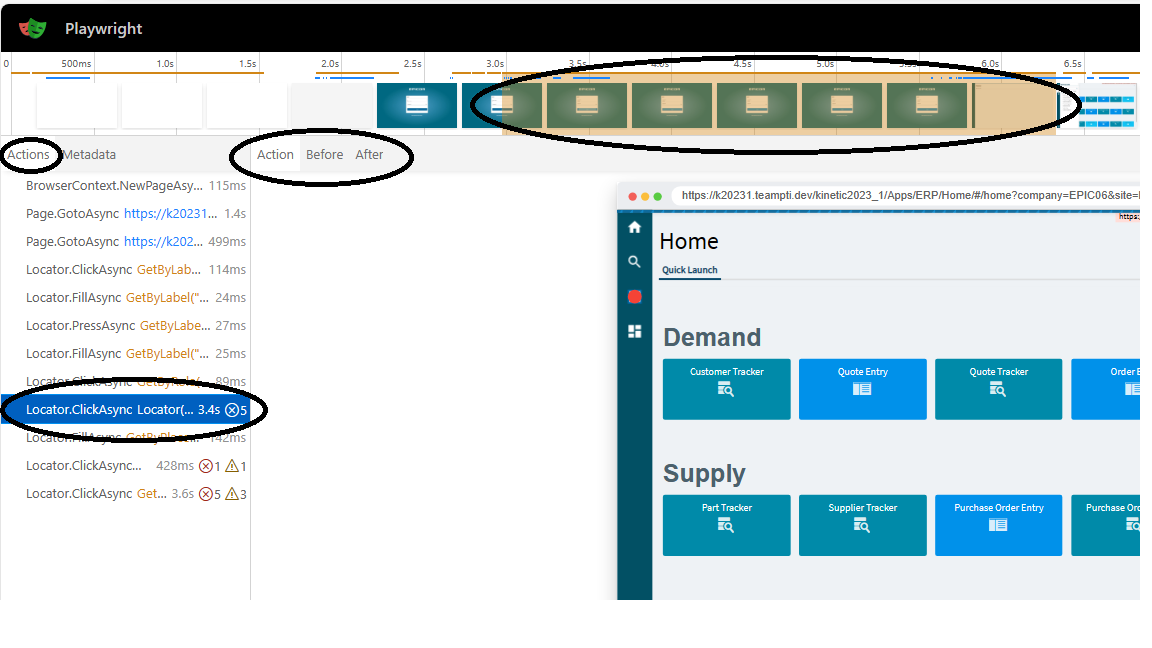
As you click on the events on the left, you will see the screen captures before and after the event. Pretty cool.

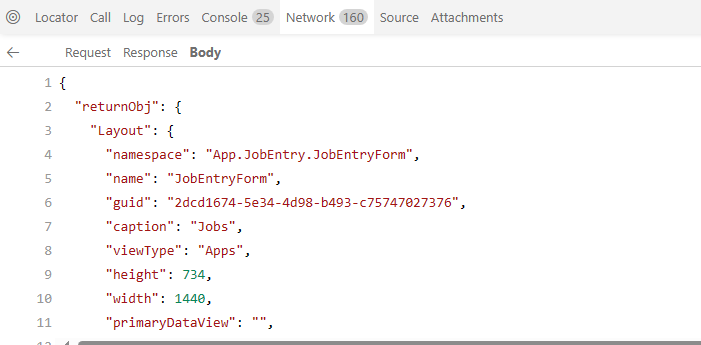
Like the Chrome Developer Tools, there is a Network tab.

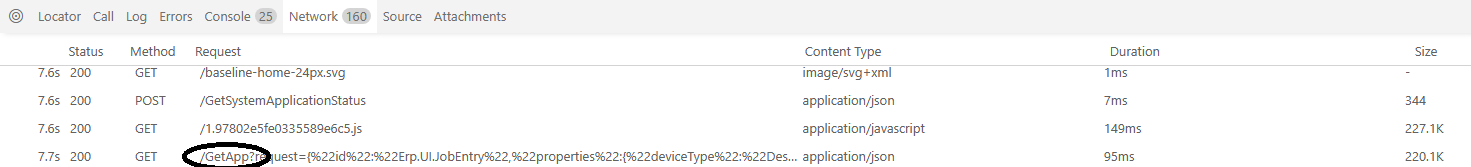
Clicking on a particular call, allows one to see the request and the response headers with body.

The trace file is a zip file that contains a folder and three files:

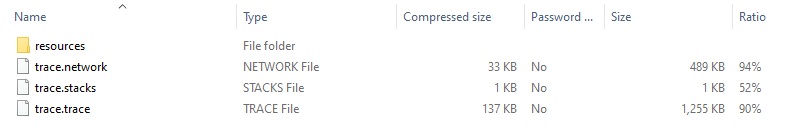
The resources folder contains the screen captures, javascript, css, etc. The trace.network file is a JSON file with each network call. Playwright does NOT scrub sensitive data, so if you’re using weak-ass credentials, I mean username and password, it WILL be in this file. It’s up to you to scrub this if you plan to share this file to Epicor support or another EpiUser member - most likely @klincecum. :wink:

Hope you all find this helpful! I recently heard on a podcast that the dev uses the screen captures from Playwright for documentation! In the future, we can talk about testing your business processes through automation to make upgrades faster. Let me know what you all think.

10 Likes

This is awesome, Mark. Thank you! :pray:

1 Like

I will try it out Mark, I am finally getting into some situations where I need to trace and am excited to learn more about this. Thanks for sharing!

For those at home following the directions above - after Save Program.cs then do a dotnet run to create your trace - if you get the warning Method 'Program.Main()' will not be used as an entry point because a synchronous entry point 'AutoGeneratedProgram.Main(string[])' was found, simply edit the [ProjectName].csproj file and add <GenerateProgramFile>false</GenerateProgramFile> and re-run dotnet run. That will prevent the competing Program.cs from being created.

I’m just trying to run their example on their install page haha :rofl: struggling.

I wonder if we could just use a console project and not add the NUnit to the original project. :thinking:

That is more important when we get to dotnet test.

I have Mattec issues to attend to but I will try that later.

2 Likes

OK, thanks Mark.

@utaylor Where are you stuck? I had to download and install Powershell Core to get this working. The Powershell built into Windows is 5.x I believe.

To get Powershell Core:

  1. Open a command prompt and type winget search Microsoft.PowerShell
  2. It’ll likely return 2 results. Type winget install --id Microsoft.Powershell --source winget

After getting that setup, I had the pwsh command available and could follow the rest of the directions.

Edit: I’m on Windows 11 Pro

I thought the younger crowd was already using PowerShell core! :rofl:

Yes, anytime you see pwsh, it’s PowerShell core. powershell.exe is the older Windows Powershell.

1 Like

This was news to me! I didn’t even know Windows had a package manager (winget) until today :slight_smile:

1 Like

I’m good on the ps

winget is relatively new. Similar to app-get from Linux.

1 Like

Where I was stuck is just understanding how this all runs, but I followed their example on their site and now have some understanding of it. I am going to set up my trace files

The crazy part is @Mark_Wonsil and @spaceage I don’t see on their webiste where they mention that you have to modify the csproj with your settings to do the trace.

All they say is this:

Traces can be recorded using the BrowserContext.Tracing API as follows:

And it’s like, “as follows?” I guess it’s just my novice web development that leaves me feeling clueless.

Somehow @Mark_Wonsil knew to add it to the project

await using var browser = await Playwright.Chromium.LaunchAsync();
await using var context = await browser.NewContextAsync();

// Start tracing before creating / navigating a page.
await context.Tracing.StartAsync(new()
{
    Screenshots = true,
    Snapshots = true,
    Sources = true
});

var page = await context.NewPageAsync();
await page.GotoAsync("https://playwright.dev");

// Stop tracing and export it into a zip archive.
await context.Tracing.StopAsync(new()
{
    Path = "trace.zip"
});

Mark is there any way you could paste your final .cs file for your test with the tracing options you enabled?

Now I am getting this after modifying what I thought to be the trace settings.

@utaylor This is what I have and it’s working:

using var playwright = await Playwright.CreateAsync();

await using var browser = await playwright.Chromium.LaunchAsync(new BrowserTypeLaunchOptions
{
    Headless = false,
});
var context = await browser.NewContextAsync();

await context.Tracing.StartAsync(new()
{
    Screenshots = true,
    Snapshots = true,
    Sources = true
});

var page = await context.NewPageAsync();

Then the recording of the clicks from the Playwright window are pasted below this, and below that, the final line of where to put the trace:

await context.Tracing.StopAsync(new() 
 {
    Path = @"C:\Users\mbadmin\Documents\KineticTracePilot\traces\trace.zip"
});

and then what cmd command are you giving to get the program to run?

just a dotnet run??

Or are you doign this:

pwsh bin/Debug/net7.0/playwright.ps1 codegen https://k20231.teampti.dev/kinetic2023_1/home

This is from the Education Database:

using Microsoft.Playwright;
using System;
using System.Threading.Tasks;

class Program
{
    public static async Task Main()
    {
        using var playwright = await Playwright.CreateAsync();
        await using var browser = await playwright.Chromium.LaunchAsync(new BrowserTypeLaunchOptions
        {
            Headless = false,
        });
        var context = await browser.NewContextAsync();
        
        await context.Tracing.StartAsync(new()
        {
            Screenshots = true,
            Snapshots = true,
            Sources = true
        });

        var page = await context.NewPageAsync();

        await page.GotoAsync("https://k20231.teampti.dev/kinetic2023_1/Apps/ERP/Home/");

        await page.GotoAsync("https://k20231.teampti.dev/kinetic2023_1/Apps/ERP/Home/#/login?previousUrl=%2Fhome");

        await page.GetByLabel("User Name").ClickAsync();

        await page.GetByLabel("User Name").FillAsync("epicor");

        await page.GetByLabel("User Name").PressAsync("Tab");

        await page.GetByLabel("Password").FillAsync("epicor");

        await page.GetByRole(AriaRole.Button, new() { Name = "Log in" }).ClickAsync();

        await page.Locator("#Menu path").Nth(1).ClickAsync();

        await page.GetByPlaceholder("Search all menu items").FillAsync("part");

        await page.GetByTitle("Production Management/Material Requirements Planning/Setup/Part", new() { Exact = true }).GetByText("Part", new() { Exact = true }).ClickAsync();

        await page.GetByRole(AriaRole.Link, new() { Name = "090-8990" }).ClickAsync();

        await context.Tracing.StopAsync(new()
        {
            Path = @"C:\Users\Administrator\source\repos\testtrace\trace.zip"
        });
    }
}

Yes, dotnet run to get the program to start. The codegen piece you posted is for setting the URI you want to profile. I wanted to profile our Pilot environment, so the command was:

pwsh playwright.ps1 codegen https://[domain].epicorsaas.com/[instance]/Apps/Erp/Home