I’m a bit bamboozled by this one.
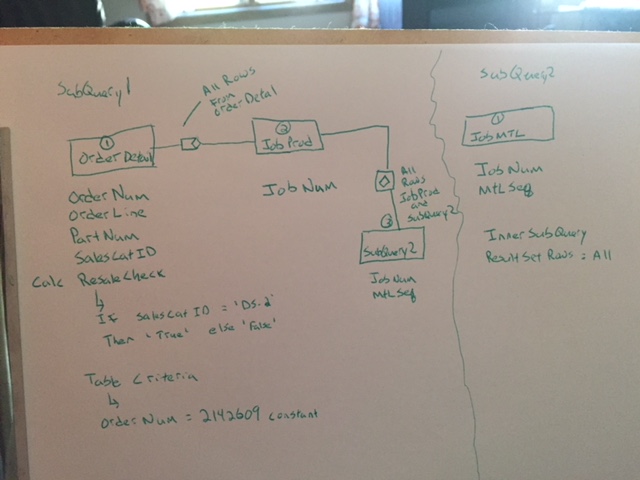
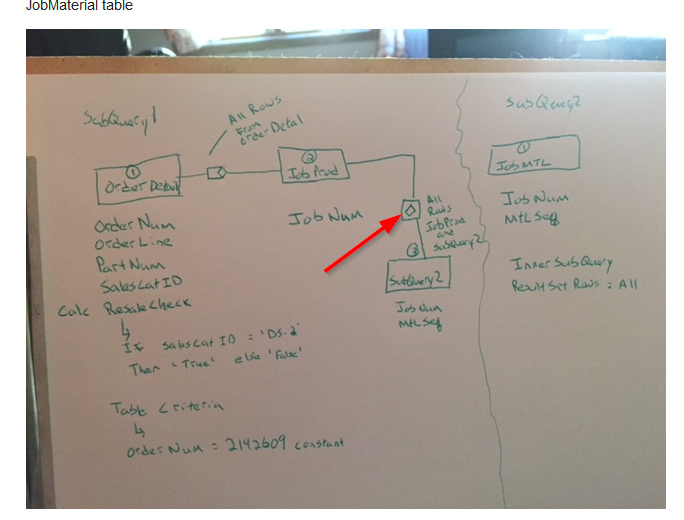
I have created a shipping analysis baq that allows us to assess on time, in full and on time in full per month by customer. As we can do multiple shipments per sales order release I need to include a sub query to get the last shipment date and total shipped quantity for each sales order release. This all works great in the BAQ and I have created a dashboard.
I have been asked to graph this data and have found the dashboard charts to be too limited. I have copied to excel and graphed this data but it requires quite a bit of faffing about.
I have tried to create a baq report but keep getting a message saying query execution failed for dataset rptlabels. Looking at the srss logs this is failing on the sub query - if I remove the sub query fields the execution works but without the data that I need.
I have recreated the query as a new data in a new report in SRSS and everything works - it just limits the amount of filtering that I can do and the interface appears different.
Doing some basic research I have seem some threads online about baq reports not working if they include inner sub queries but generally no confirmation that this is the case or resolutions. I’m just wondering if anyone else has come across this and it is indeed a limitation of baq reports or if there is some clever fix.