I created several BAQ’s that can manipulated into summary with totals. Is it possible to have the BAQ be saved as summary and be manipulated to display detail?
Thanks in Advance.
Miguel Lopez
I created several BAQ’s that can manipulated into summary with totals. Is it possible to have the BAQ be saved as summary and be manipulated to display detail?
Thanks in Advance.
Miguel Lopez
More detail would be helpful, but I have found that it’s easier to filter in a dashboard. And as far as I know, if the BAQ is summarized you will not be able to see detail in a dashboard.
So, It is possible to create a summery dashboard so the user doesn’t have to manipulate the detail screen to get the same result?
Yes, it is possible. If you using groups in the dashboards and use the summary feature for columns you can get to a summarized version of what you would like to see and then they can toggle the group to see the detail.
Try right clicking on the column headers of a dashboard grid and choose the grouping option. You can then create groups.
I forget how to save the dashboard this way, whether you have to make a personalization or a customization or if you can straight up deploy it this way.
Using advance grouping you can create ‘pivot’ table type data summaries.
I usually deploy the dashboard and put it in a menu somewhere. FYI - I got this good advice from somebody else… save the dashboard in a menu called Custom. i.e. I have Job Mgmt > Custom > Job Dashboard1, Job Dahsboard2, ect. And Purchase Mgmt > Custom > PO Db1, PODb2. etc. Of course I use meaningful names.
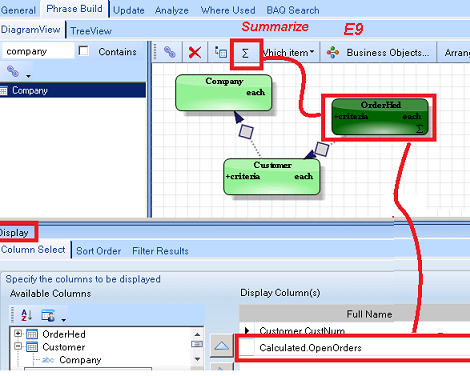
@RC2020 E9 had a sigma button that would summarize the data. But if you want to also allow seeing the detail then you need to do the baq in detail and then add summing and group by in the dashboard.
e.g. summarized OrderHed in an E9 BAQ
