Hi Everyone,
Is there a report of something that you can run that shows you the amount of parts you produced by date range?
Thanks
Tanya
There is no out-of-the-box report or dashboard showing that information, but if you are familiar with BAQs you could write a query that would dig it out for you.
One catch is create a BAQ to find finished parts being moved to stock or shipped to customer etc by date. Then use count function to sum the total parts produced.
Thank you I was shown once how to do BAQ’s but still have to see it a couple times.
So the first question we need to answer is, what constitutes a “produced part” in your enviornment? Is it when a job is received to inventory OR shipped directly to a customer (that’s what I’d use)?
These values are all in the PartTran table, so it’s a fairly easy query to build, and there are all kinds of things you can do the the dashboard we’ll build from it to make it more or differently useful.
Open the Business Activity Queries program (maximize the window), create a new query, and give it a name and description, then save it. Click on the “Query Builder” tab.
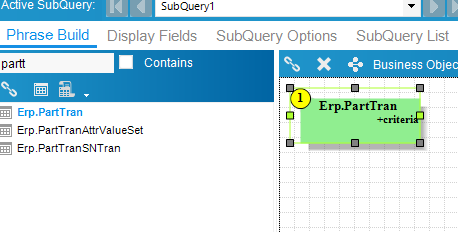
There’s a list of table names on the left side, just above that there is a blank line where you can search for the table you want… in your case type “PartTran” in that space, and you’ll see Erp.PartTran and a couple of others. Click on “Erp.PartTran” and drag it over into the gridded area to the right. A green rectangle appears. Click on the green rectangle to make it outlined.
Down towards the bottom of the window is another area with “Table Criteria” showing in blue. You want to filter these results to only show SOME of the data in this table. (The PartTran table is the largest table in Epicor… it holds data about every single transaction that involves a Part Number. You’ll ALWAYS want to filter this table when querying it.)
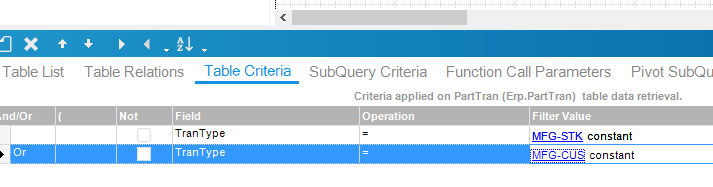
Click the farthest left “new” icon (directly above where “Table Criteria” is highlighted), and now you need to tell it how to filter. You want all transactions where the TranType (transaction code, meaning what this transaction is actually doing) is either going from a job to stock or from a job to shipping… so you need TWO filters. The first on in my list is where the TranType is MFG-STK (literally "Manufacturing to Stock, or a job receipt to inventory). When you click that New icon, it shows a blank line. You’ll need to use the dropdown under “Field” to find TranType, and then use the dropdown under “Filter Value” to find “specified constant”… click the word “specified” (which should be in blue and underlined) and a box will open where you can type in the value (MFG-STK). Now click the New icon again, and in the farthest left field (labeled “And/Or”) use the dropdown to select “Or”, choose the TranType field again and this time specify MFG-CUS.
Now click on the Display Fields tab (just next to the Phrase Build tab).
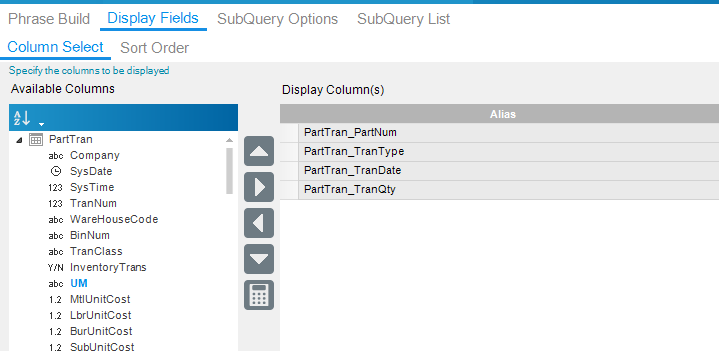
You’ll want to select the PartNum, TranType, TranDate, and TranQty fields (maybe others later, but at least these for now)
Up at the top of the window, click on the Analyze tab

then click the “Test” button at the bottom of the window. Most likely a LOT of data will show up, and you might get a message saying the output has been limited to 10000 records.
Let me know how that went and then we can look to create a dashboard… where you can set date ranges and filter on part numbers.
1 Like
Wow Thank you so much I really appreciate it.
You could use the Material Transaction Detail report if all you’re interested in is something like all MFG-STK transactions in a date period. You would just need to filter on the transaction type.
Thank you so much
Ernie,
I was able to follow the instructions provided and would like to continue with the remaining steps to complete this report. I am working with Tanya on this project!
Ernie,
Hopefully this ends up in your email!
Would anyone else in the forum be able to take over and help us finish this task? Ernie is MIA
Sorry so long between replies… it’s been a busy summer. And I haven’t even had a vacation yet!
Let’s make one change to the BAQ created before… open it up and you’ll see a checkbox labeled “Shared”. If that box remains unchecked, nobody else will be able to use the dashboard you’re about to create. If you want others to enjoy the fruits of your labor, check that checkbox and then click Save.
Close the BAQ program, go to the Epicor menu search, and type in Dashboard. In the search results, click on the one that says just “Dashboard”… NOT “Dashboard Maintenance” or any of the others. When the program opens, you should see several fields and checkboxes… if you only see a couple of fields and no checkboxes, go to the Actions menu and click “Developer” (and when you do that, the other fields and checkboxes should appear… if they don’t or if you don’t have a “Developer” option under the Actions menu, you don’t have the permissions necessary to create a dashboard. Check with your System Admin).
Once you’re in, go to the New menu and select New Dashboard. Give it a name, and then enter a Caption (short description) and optionally a Description (long description). Click Save. Now go to the New menu again and select New Query. Type in (or search for and select) the name of the query you made before and click OK.
If you’re still on the General tab, click onto the Dashboard tab.
Now click the Refresh icon in the top row… you should see all the data from your query… and this is where the fun begins. You said you want to use a date range filter.
Over on the left side of the window is the tree view… it shows your query name on the first line and then the query name again with “Summary” on the second line. I want you to right-click on the first line, and in the menu that shows up click “New Tracker View”.
This now shows the list of fields in your query, and gives you the choice of which one (or ones) you want to be able to filter by. Start by clicking the Clear All button and seeing that all the checkmarks under “Visible” disappear. (Just for fun, click the Select All button now and see what happens… then click Clear All again). You want to filter by date, so put a check mark in the Visible column next to the PartTran_TranDate field. Note that the checkbox to the right after the Date field is now open for input… check that box too. Note now that the field in the Condition column says “Equals”… meaning we want to enter an EXACT date… not what you want. You want a range, so you need to give both lower and an upper date. This field is a dropdown, and although you can make this either the upper or the lower limit, I always use the lower limit here. Select “Greaterthanorequalto”. Below and to the left are two more checkboxes… Input Prompts Only and Criteria Required… I would strongly recommend that you check them both. For more information on what they do, you can read up on them in the Dashboard Education Course. Now click OK.
The bottom half of your dashboard has been replaced by a big blank area with a single field. If you put a date in this field and then click Refresh, you’ll see every transaction ON or AFTER that date… because we told Epicor to use that date as a lower limit filter .
Adding the upper limit filter is a little more challenging.
Back to the tree on the left… now there’s a third line that says your query name and “Tracker”. Right-click on that and select “Customize Tracker View”.
Ever done any screen customizations? This is the same toolkit. If you’ve never done them before, I don’t recommend you start here… take that education course.
If you HAVE used this toolkit before, go to the Tools menu and select Toolbox. Place an EpiDateTimeEditor dropbox to the right of the date field already there. Make sure the Customization Tools Dialog is focused on it. Change the IsTrackerQueryControl setting to True, select PartTran_TranDate as the QueryColumn, scroll up in the editor and change the DashboardCondition to LessThanOrEqualTo, and change the DashboardPrompt to True. Save the customization, and close the Customization Tools Dialog (the Toolbox will close with it). Now put dates in both fields and click refresh.
There are ALL KINDS of additional things you can do here… this is a basic beginning.
Have fun!
@Ernie taught me subqueries a thousand years ago to solve this exact problem.
They keep him busy these days, happy to jump in if you need help.
1 Like
I was in developer mode but no option to save while following your instructions. Thoughts?
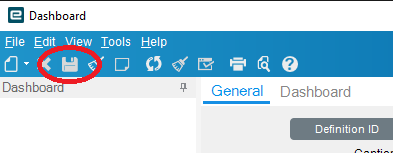
My save option was grayed out. Disregard this, the sys admin set me up as a developer not an admin. Now I can view everything. I thought I was an admin because I was able to enter developer mode.