So Monday of last week we went live with a jump from 2021 to 2023.1.9
The upgrade process itself was fine there were some minor issues particularly around PCID where a bunch of new features were added that caused some headaches but overall it was a clean and easy upgrade.
However immediately we noticed everything was running rather sluggish and we blamed SQL per usual, did some index maintenance , statistics etc and moved on with our lives. We continued to get non stop gripping and complaints from users all week about performance and while we weren’t necessarily able to replicate the described issues we did notice somethings that were taking forever. For example opening the BPM Code window was taking between 45-60 seconds every time. We did some tracing and saw that BPM window now downloads a bunch of files from the server including the Epicor Data Model which is 40+MB in size
This was a little odd but after asking around it has to do with the client compiling back end code in BPM and it requires the data model and the framework stuff which it doesn’t have off the bat
Anyway we thought it was only this behavior and this screen and moved on with our lives. But the more the week went on the more complaints we gathered. Eventually we were able to find a smoking gun we could replicate. Opening Customer Tracker and Loading a Customer was taking upwards of 2 minutes.
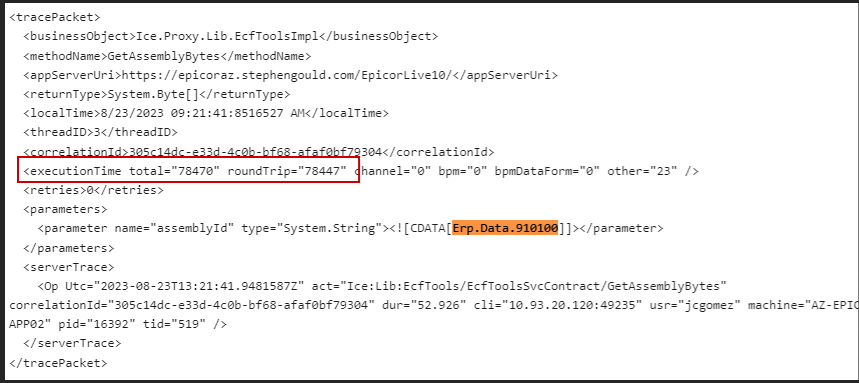
We did some tracing and found out the performance issues came from doing a GetByID on the customization in customer tracker which is 6MB in size and was taking 12 seconds to load by itself.

Furthermore running 2 BAQs to get Customer Invoices was taking 60+ seconds a piece. As we tried to explain this we replicated these calls in Postman and quickly saw that the REST calls in postman to the same business object with the same parameters were coming back incredibly faster that same call from above that took 12 seconds in the client was taking 1 seconds in postman

How to explain this? After a lot of investigation and network pattern checking and using fiddler to monitor the actual network calls we found the smoking gun.
The call in postman was returning 454K of data

While the SAME call from the client was returning 6Megs

The culprit? COMPRESSION! JSON calls are compressed in transit, but the Smart Client (Classic) uses RPC to make the same calls which uses a custom binary encoding mechanism which is NOT being compressed in transit. Thankfully compression happens at a low level in NET so after sniffing around a bit longer we found a setting in the web config that allows you to turn on / off compression based on content type. It was already set for JSON

As a test I added the custom epicor content type turned on compression and crossed my fingers, my hope was that this was low level enough in the HTTPS transport that the client wouldn’t break, we got lucky and it worked. Once I turned on compression for the epicor content type used in RCP that call that was downloading 6 Megs went down to 17K ![]()

Here is a side by side demo of a query run with compression vs not

The fix is easy just open your web.config and add the following line to the compression section both in static and dynamic
<add mimeType="application/x-epicor-erp-rpc" enabled="true" />
Then recycle and restart your appserver.

I don’t know if this is an issue with their cloud deployment yet I am opening a ticket with support, but I know everyone that has 2023 on prem has looked and this compression is indeed off.
Obviously test everything in a separate environment before you go making random web config changes. But the difference is huge particularly if you run epicor from 47 different parts of the world.
CC: @Rich @Epic_Santiago, @timshuwy
Case: CS0003846921