@jgehling
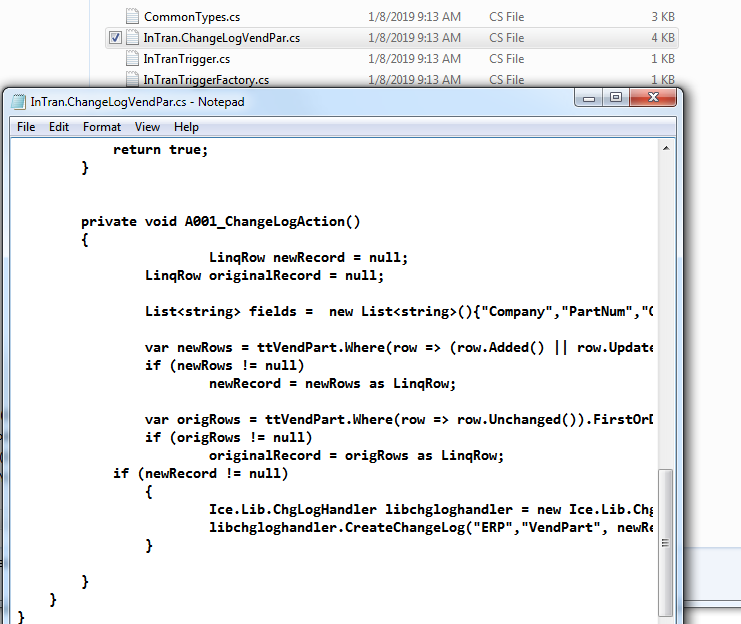
If you create a Custom BPM or even a ChangeLog, and you go to:
\\SERVER\inetpub\EpicorERP\Server\BPM\Sources
You will see the source code generated by the BPM and basically analyzing that and running SQL Profiler, helped.
You can also learn from it, if you let’s say add an AutoPrint node and save, you can see the code generated and you could re-created the AutoPrint logic in a Code block then 
Another Great Tool if you want to understand Epicor is:
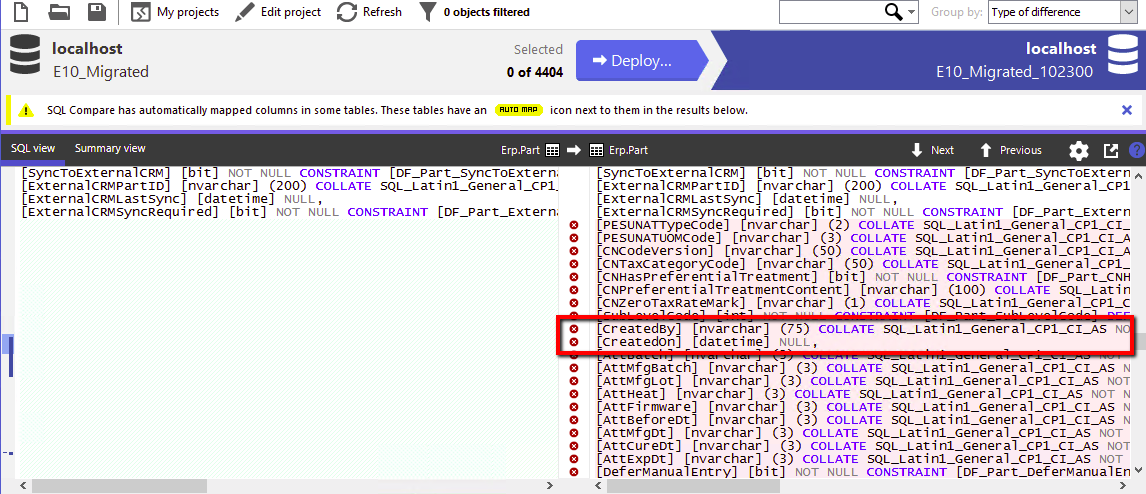
SQL Data Compare: Compare And Synchronize SQL Server Database Contents - you could take a backup, run MRP and then compare your backup to your database and see all the tables an MRP run affected.
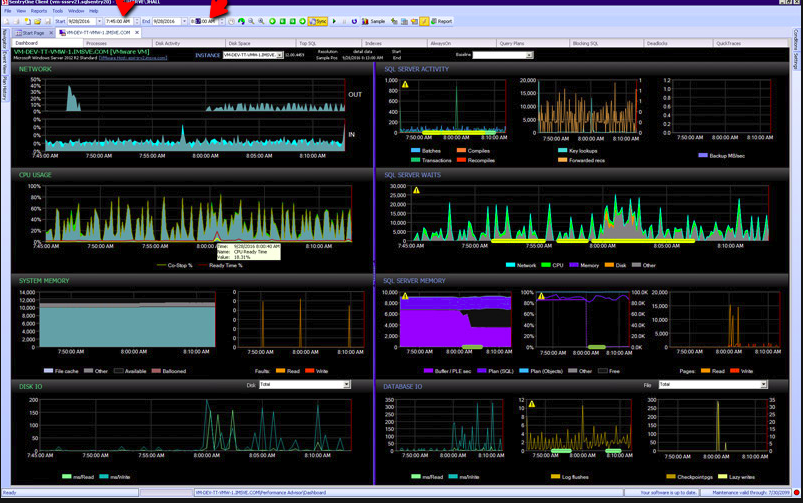
Another tool I like is SentryOne SQL
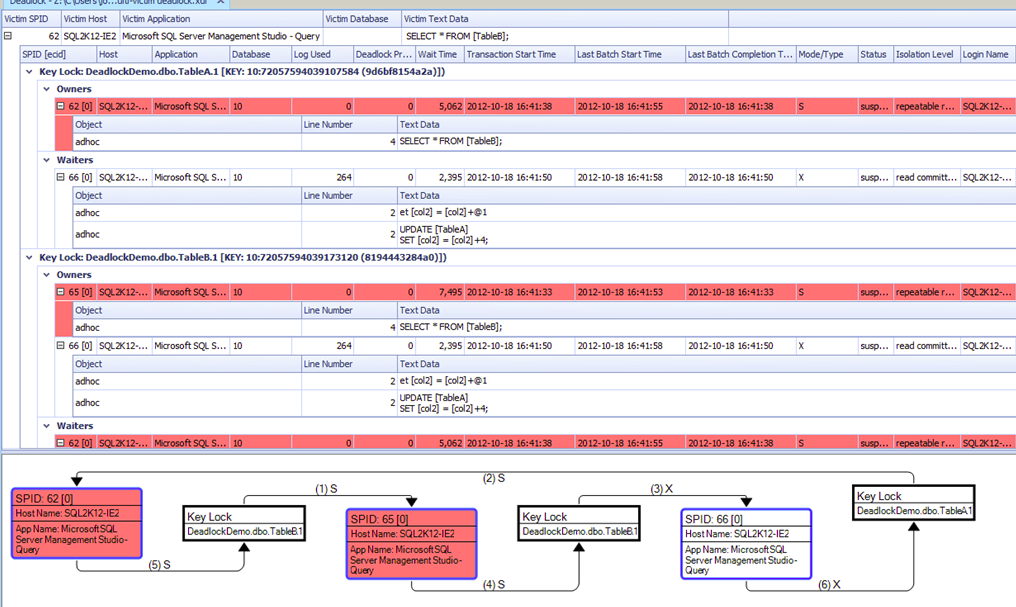
Basically that one SQL Profiles your Database, but also populates all the variables which SQL Profiler doesnt do so good – when someone says MRP Crashed at 3am, I can go back in time to that second and review Deadlocks, which Queries ran etc…
But Most Importantly I can study How MRP Runs… All of its logic:
Everytime I upgrade to Epicor Major Version I run Data Compare and Structure Compare and within seconds I know if any of my data has been moved, changed, modified and all the new columns Epicor added, removed and renamed…
When someone says this used to work in Production, I compare Database to a .bak and I can tell them all the settings modified since the so claimed used to work date. “Did you know this ShipTo’s Demand Flags were on then…”
Get some PowerTools and you become Fast, Accurate.