BPM SPEED Helpful Hint - be careful how you "Join"

Help Hint for you all…
I have been doing some refactoring of BPMs for efficiency. Finding mistakes made from prior sins of myself and others. You can probably find some ways to improve your end user’s experience by doing some of these same changes… note that this refactoring takes about 5 minutes, but saves users lots of frustrations. THIS example is applicable to all users (including Cloud). Also, as an encouragement to those NOT attending Insights… I learned about the need for this trick last year at insights during the E10Help forum meeting. (thank you!)

I assembled this example to demonstrate how a simple mistake can cost seconds of time.
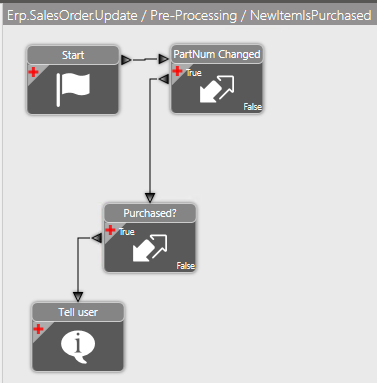
EXAMPLE BPM:

BPM Specification: If a sales order line is entered for a part that is marked as purchased in the part master, throw a message to the screen.

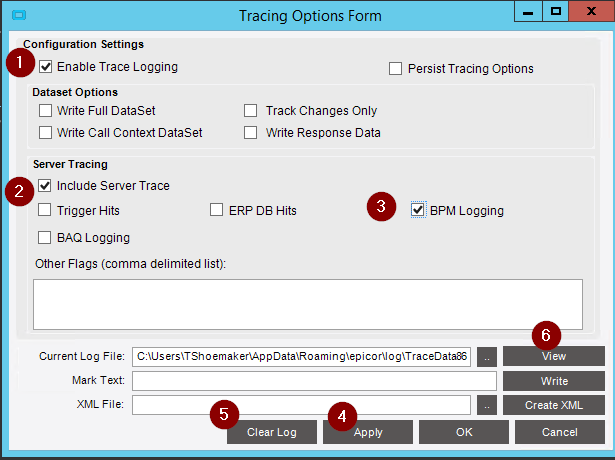
My first version (done the wrong way) takes takes an average of 100 milliseconds per the trace log:

<BpmDirective Type="1" ID="925597c7-0e43-4590-9601-22ac948497cd" Name="NewItemIsPurchased" VisibilityScope="0" Duration="100" />

The NEW version (done better) takes only 2 milliseconds:

<BpmDirective Type="1" ID="925597c7-0e43-4590-9601-22ac948497cd" Name="NewItemIsPurchased" VisibilityScope="0" Duration="2" />

WHY DOES THIS MATTER? You might be thinking “100ms is only 1/10th of a second”… “most of the time” it is not a big deal… BUT in some cases, especially when BPMs run repetitively, this turns into seconds. Example, a 30 line order being imported via DMT, or ECC, or Quote Converstion will turn into at least 3 seconds of wait time. Consider a BPM on OrderRel, and lets pretend you have another BPM that “Firms” all the releases after you are all done entering the order. Your 3 seconds just turned to 6 seconds.

How were these built?
Version 1 (slow) looks like this… the PROBLEM is that it joins ttOrderDtl to Part using a join… THIS IS BAD PRACTICE, and has been discussed in the past on this very forum.
image

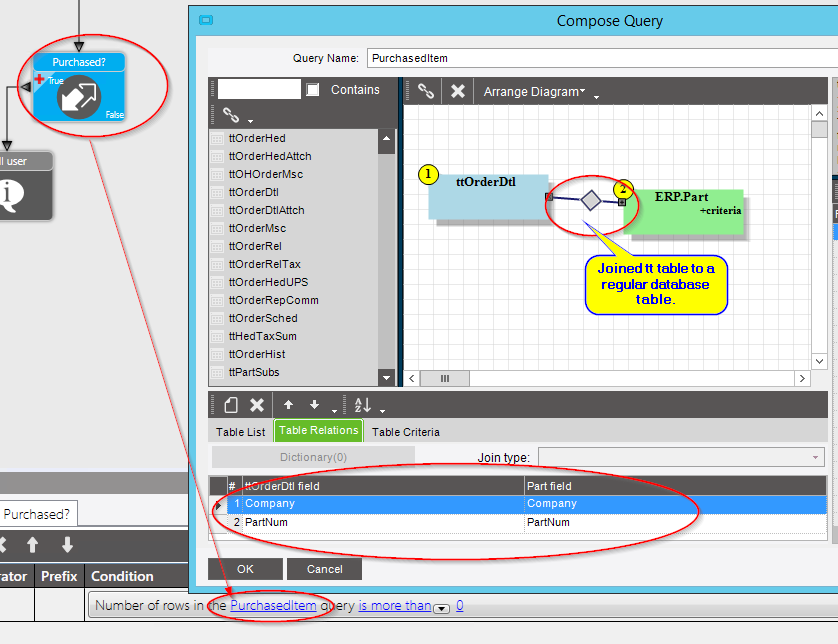
The NEW version eliminates the join… instead, we create a variable to hold the part… populate that variable, and then filter the part using that variable:

IN ADDITION… I will mention that I did try to do the entire check using C# code instead of widgets, and found that it still took 1-2 Milliseconds to run… So… in this case, Widgets win!

15 Likes

Isn’t the first version you present of this the obvious way of solving the problem which you would expect most users to try first?
If Epicor is generating code which runs needlessly slowly in this scenario shouldn’t it be considered a bug?

Epicor is a platform with in built flexibility via the graphical BPM tool to make the core system transactions align with your business processes. However underlying all of this are the principles of C#, SQL and data queries but you do need any understanding of them to create functioning bpm’s.

Enthusiastic amateurs who don’t fully understand these principles will be able to create functioning BPM’s that will do what they want but these may be sub-optimal. I’m not sure that I see this as a bug any more than one programmer being able to achieve with a few lines of code what another programmer takes tens of lines of code to do.

1 Like

How did you generate those run times? I’d like to compare the difference on my own BPMs before changing them.

1 Like

Derek, I personally agree, and have stated this internally that we “lead you down the wrong path”. I have written dozens of BPMs the “wrong way” because of this.
That said, the wrong way MOST of the time has little effect, because of where the BPM fires… but in my most recent case, i had a BPM that fired 250 times in a row (sales order releases), and that little 1/8-1/4 second is multiplied.

Ashley, it is fairly simple to see the run times…

  1. turn on tracing (bubbles 1-4 in image below)
  2. get ready to do your transaction that will trigger the BPM.
  3. clear the Trace Log (Bubble 5)
  4. do your transaction
  5. view the trace log (bubble 6)
  6. search for your BPM name… also make sure that you search for ALL occurrences of it, as it might be triggered multiple times, but only consume time for some of the triggered events.
    Note that the “Duration” is in milliseconds, so if you see a Duration=“100”, that is equal to 1/10 second. Duration=“1000” - you have now hit the 1 second mark.I found that any BPM that does “something” will take 1-20ms. But, if you have the write conditions setup on the BPM trigger, it will often register 0ms.
    image
1 Like

Also ASHLEY… it would be really interesting to know what your results are as well… interested if this helps others.

Thank you, Tim. I don’t have the Server Tracing options in the client, presumably because I’m on 10.1? If I check Include Server Trace, and BPM Logging is set on the Application Server Settings in the admin console, will that give me BPM results in my local log?

I’ll give it a shot as soon as I can. I can get it from the server logs if necessary.

Your userID may not have all the features turned on.

Has no effect, except to turn those on by default. I found previous timing of BPMs in the server logs, though. I can still get it.
image

1 Like

The first one I tried dropped from 281 to 114! Very nice.

1 Like

So just a heads up, you will need to handle if you have something to put in that variable or not. For example, if you have a BPM on JobEntry update, this will fire and not always populated everything in the dataset, so you have to check for that row to be there first, and then set the variable, or else you will get an exception.

3 Likes

Thanks for detailing this. I can confirm it’s a useful exercise because we went through the same a little while ago and it helped significantly in some cases.

I also support @dmaclucas in a bit of concern about the whole approach to customers and BPMs. In the sales process from Epicor they were a key area of interest for us because our previous system was totally locked down, and they were presented as everything we’d need, which they are because at least for on-premise they’re very powerful. But it quickly becomes clear that they are best used by people who know what they’re doing, and the graphical “easy-to-use-for-amateurs” appearance and initial presentation is actually at odds with the level of expertise needed. I’ve come to the conclusion that to create a proper BPM using widgets, you should probably be able to write it in custom code first. In some ways the widgets actually make things less clear.

For example, in the “correct” BPM above, it isn’t obvious that a single variable will work if there are multiple lines affected. If you’re new to the system, even with coding experience, the only way to see what it does is to try it.

It does just feel like there’s a missing piece somewhere in Epicor’s support of customizing the system, where seriously powerful capability is dressed up with a slightly unhelpful “this is easy” layer. I understand some things probably have to be held back, not least for the SDK licence, but I sometimes think I’d trade all the graphical interface for comprehensive technical documentation.

1 Like

For Reference the research:

1 Like

This is normal Entity Framework behavior, but the question remains - will Epicor tweak their auto-generated code to handle it differently when someone uses the BPM Query Designer, given that 99% of users are joining and will continue to join on ttTable. I have done that for 2yrs until I noticed a small query taking a long time.

Also how do you handle a foreach loop via the BPM Designer if ttTable does have multiple records. Would be nice to add a “Loop” widget :slight_smile:

“So it appears the assumption I made was correct, joining to the class object causes the “join” to occur in memory post SQL query so it would yield a much slower result… Good stuff!” - Jose

You need to always be aware that joining to an in memory structure is problematic. Sorry I did not review your question to dig it out.

I run into this in internal reviews as well. I still have not looked at your complete scenario but one of the things folks do a lot is push the ttrows (or some subset of columns) into the db as a ‘temp table’ and join against it. Very quick then even with millions of db records in partTran, etc type tables. The push of the data into the temp table and cleanup of records afterwards is many times faster than the ‘join to tt’
– Bart

agree…

  1. looping has been a challenge. I always end up with C# code if I need to loop
  2. you are probably right that 99% of users are incorrectly joining tt to db tables… but I would say that probably 99% of the time, it is ok, and has no significant impact for a “normal” BPM. BUT if the BPM happens to be triggered by large order imports, or by MRP creating Jobs, or some other repetitive process, it WILL have noticeable impact.
1 Like

Agreed, wont be noticable in many cases and you don’t really JOIN all the time to the big tables. I only notice it when going to Db.Part, Db.PartTran, Db.ShipDtl, Db.TranGLC and the downside is just performance, some people never care about query taking 23 seconds.

1 Like

Don’t forget your friend and mine, LaborDtl !

1 Like

Where is @Patrick.Ferrington :slight_smile:

1 Like